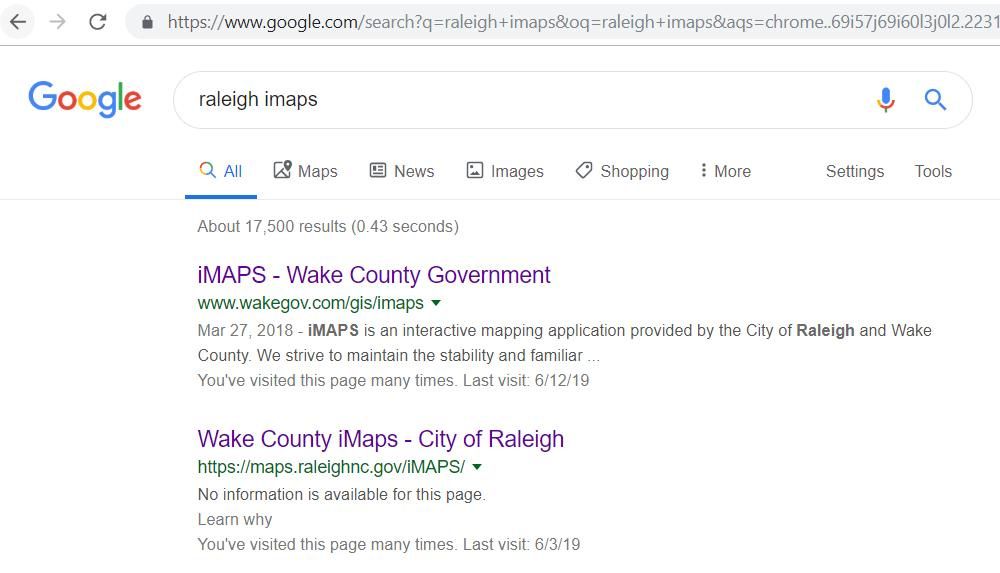
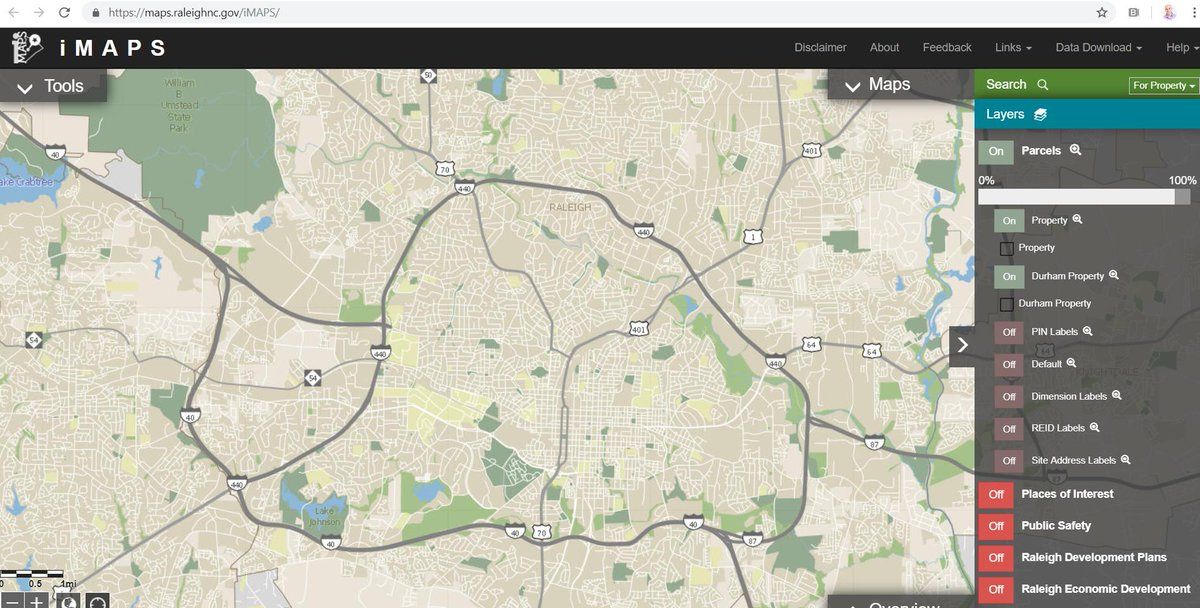
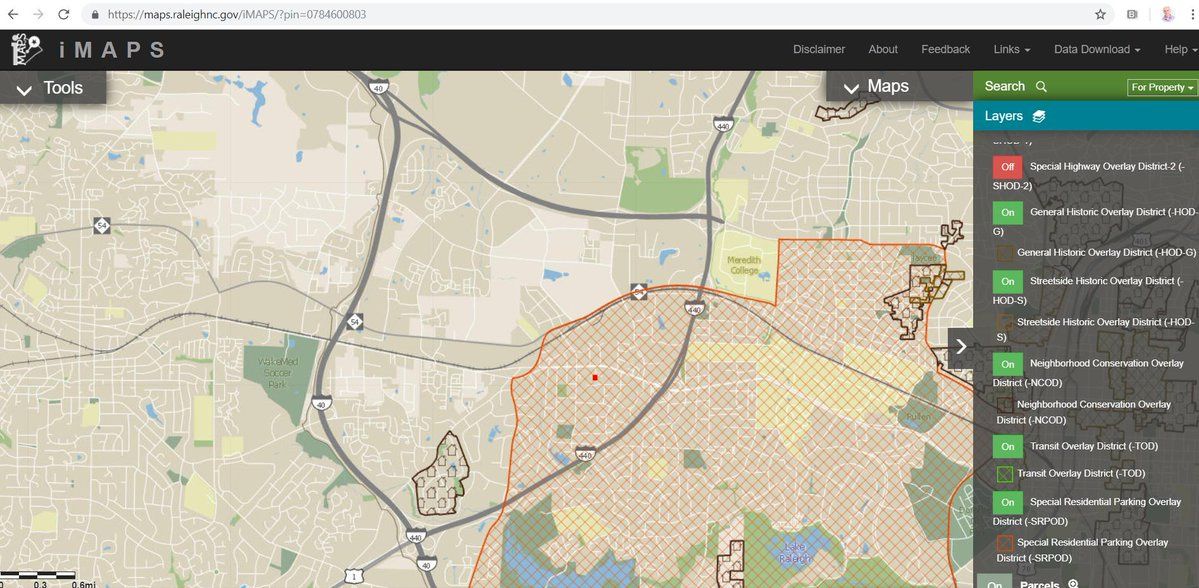
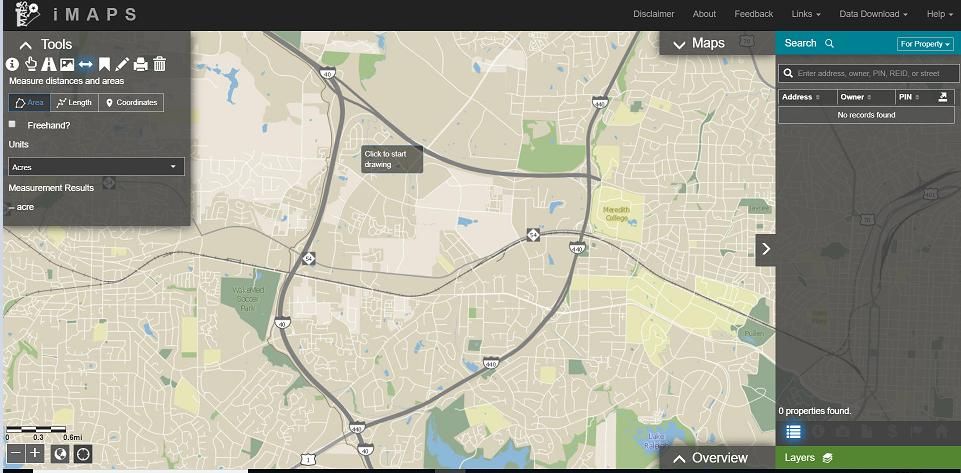
The other tool, that I got progressively better at while looking at the ITB housing by CAC was Imaps. I don’t know how Imaps came to be or the story there, but it is amazing! I only really use the “tools” in the top left, search on top right, & some of the “layers” below tools.
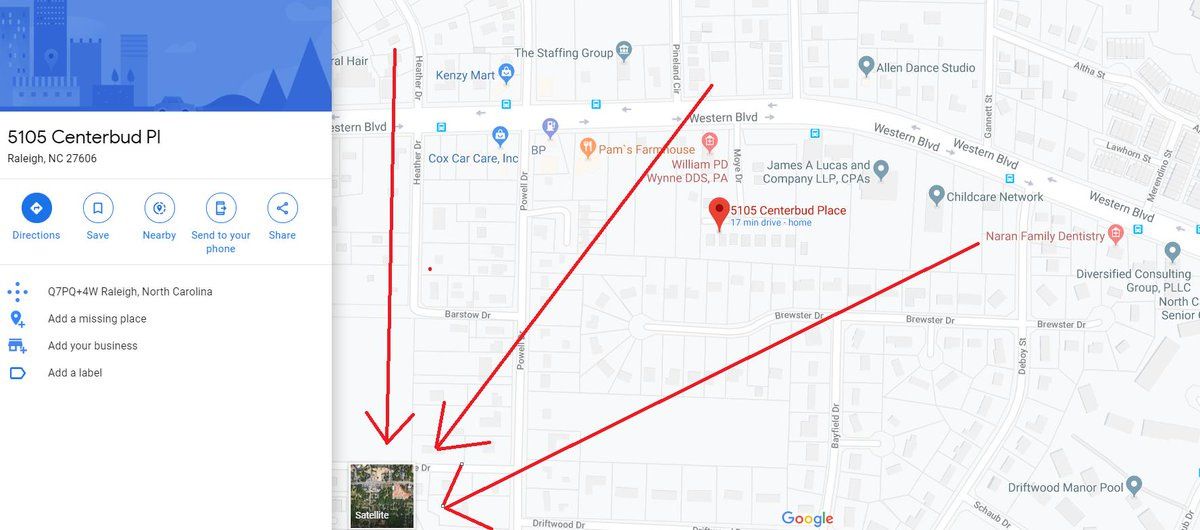
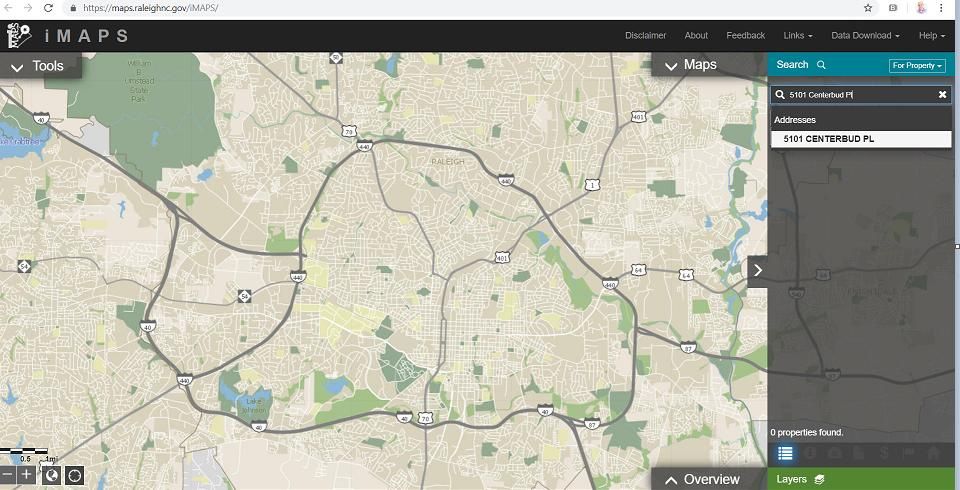
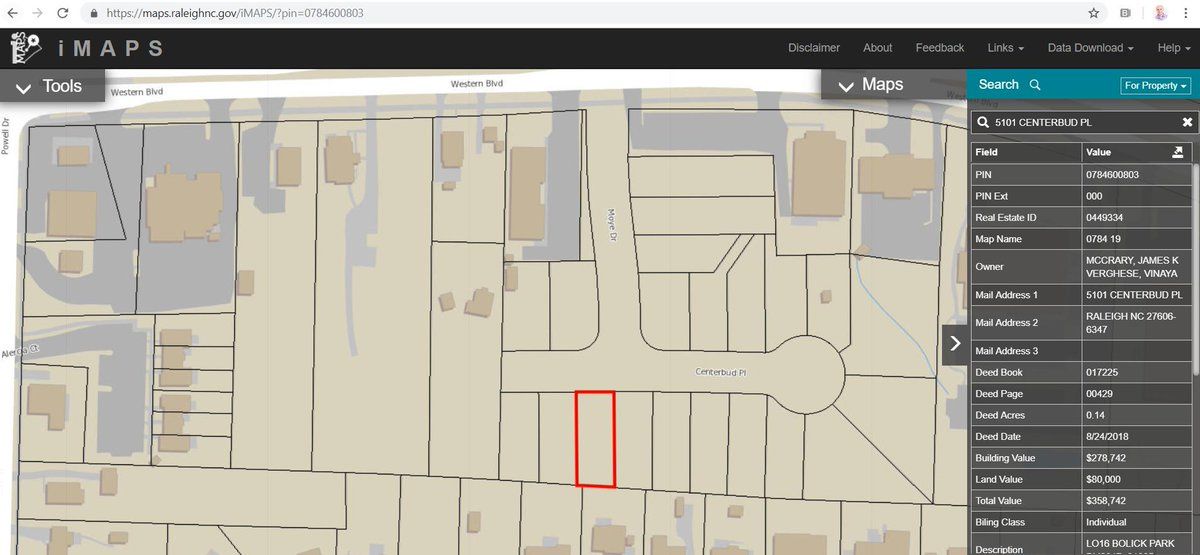
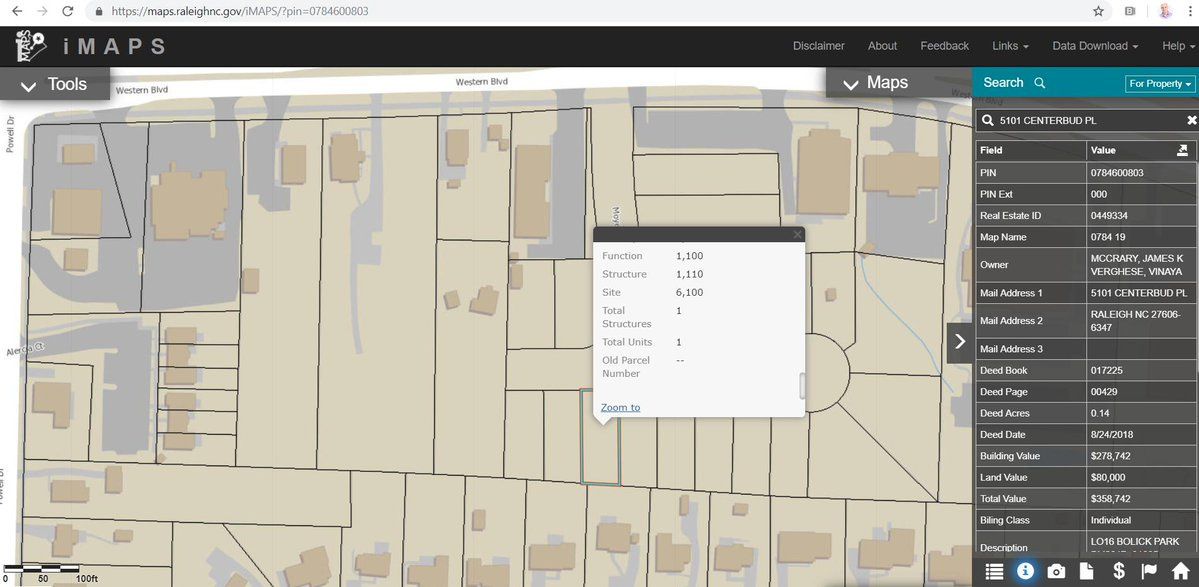
Search is pretty simple, but I found that Imaps gets confused if you put in the zip code and city info. Just put in the # and street. This will take your right to a property & give lots of info on it. I will often click on a property then scroll down to see the # of units.
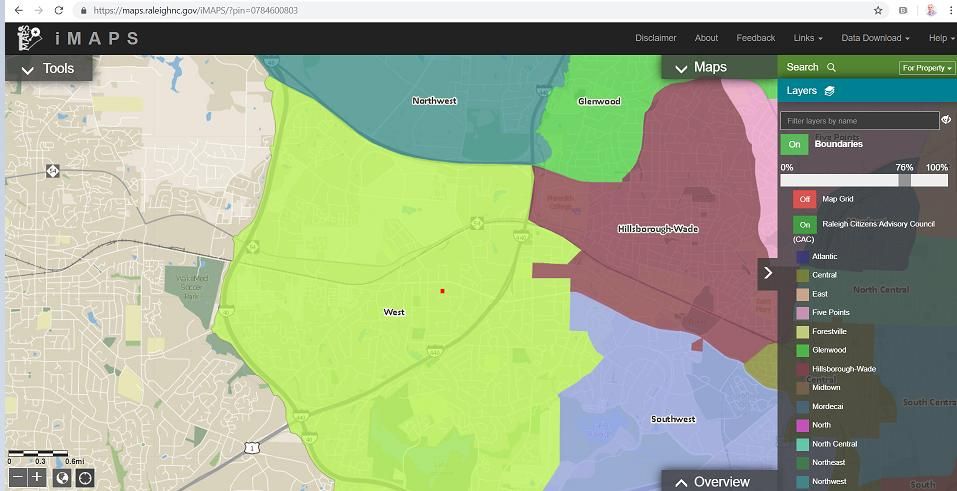
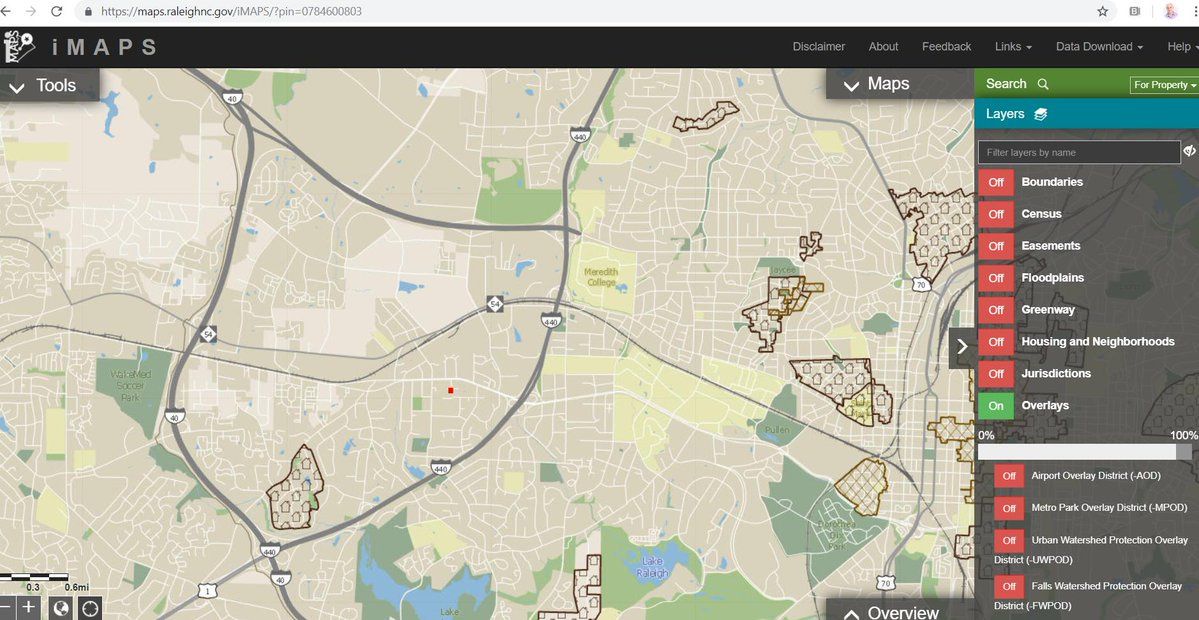
There are a lot of interesting “layers”. “Boundaries” → “Raleigh Citizen Advisory Councils” is good one. “Overlays” → NCOD & Historic are good too.
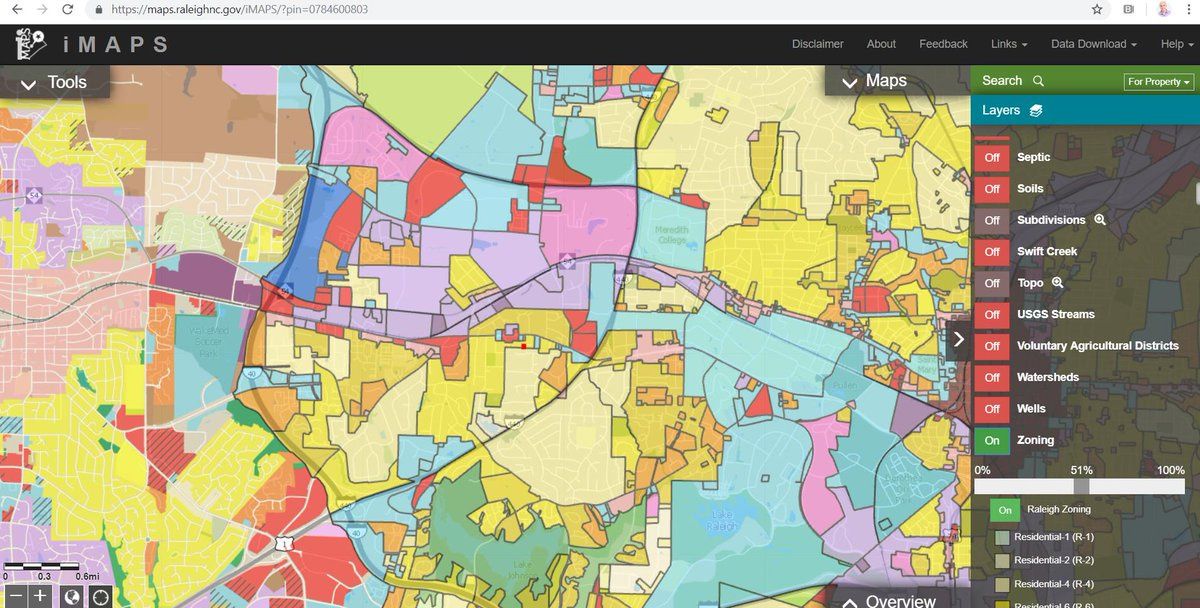
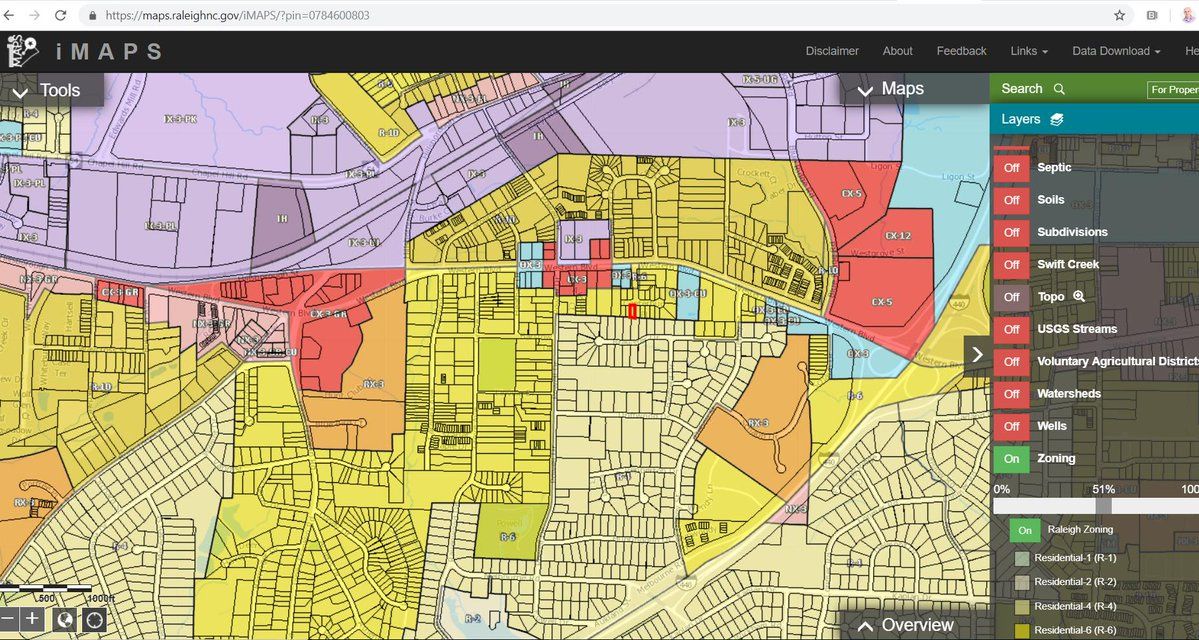
And of course the big one. ZONING! If you zoom in the zoning comes up over the property. Then with this layer on you can click on a property & see more detail. This one is in a group of R-6. Residential 6 units per acre. Duplexes allowed (but generally discouraged).
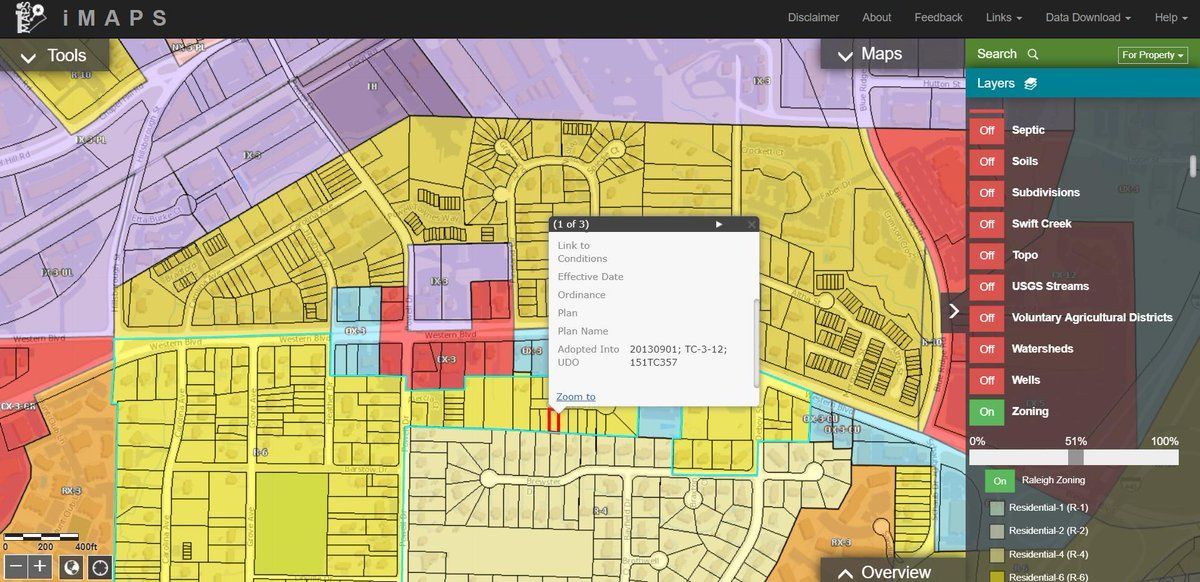
Scroll down and you can see when the property got its current zoning. Anyone have advice on how to find more details on the zoning case? I always just google Raleigh and the case#
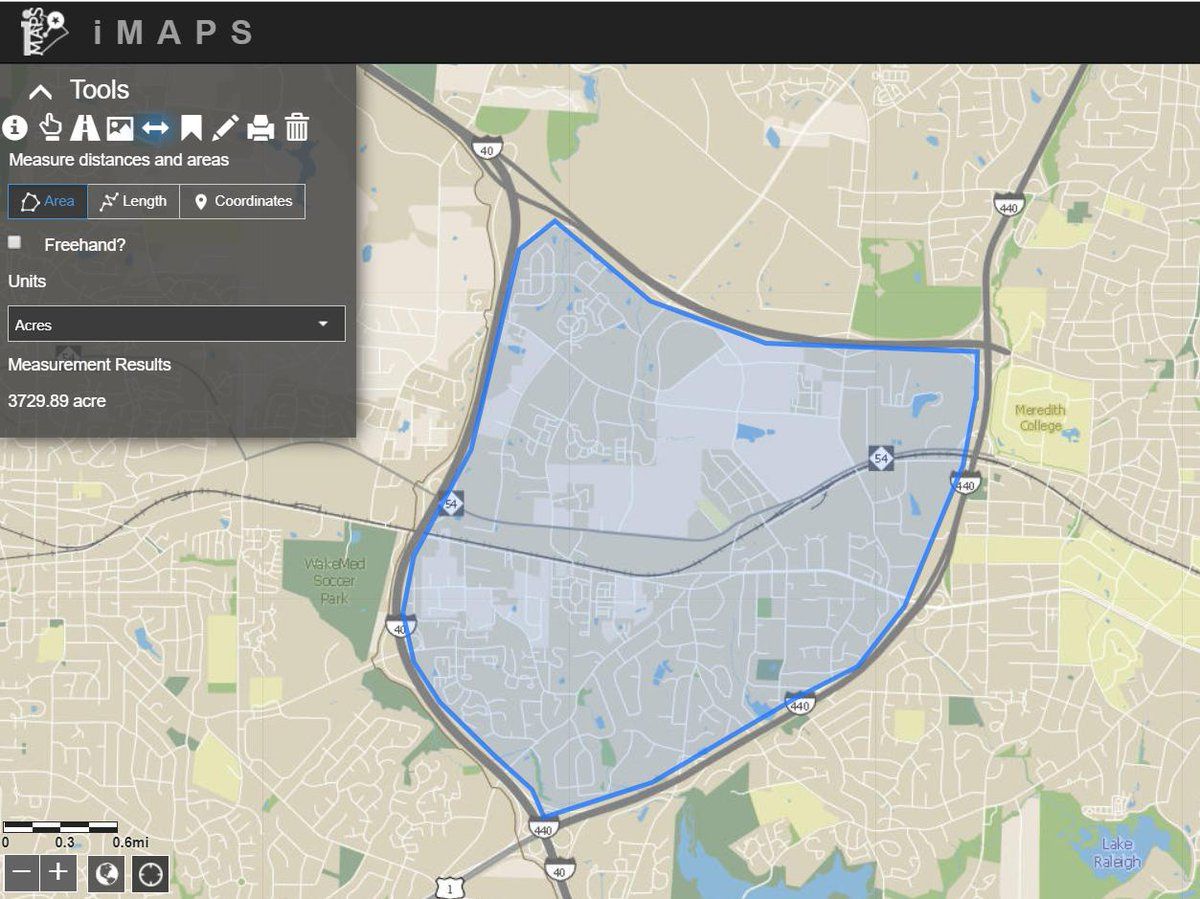
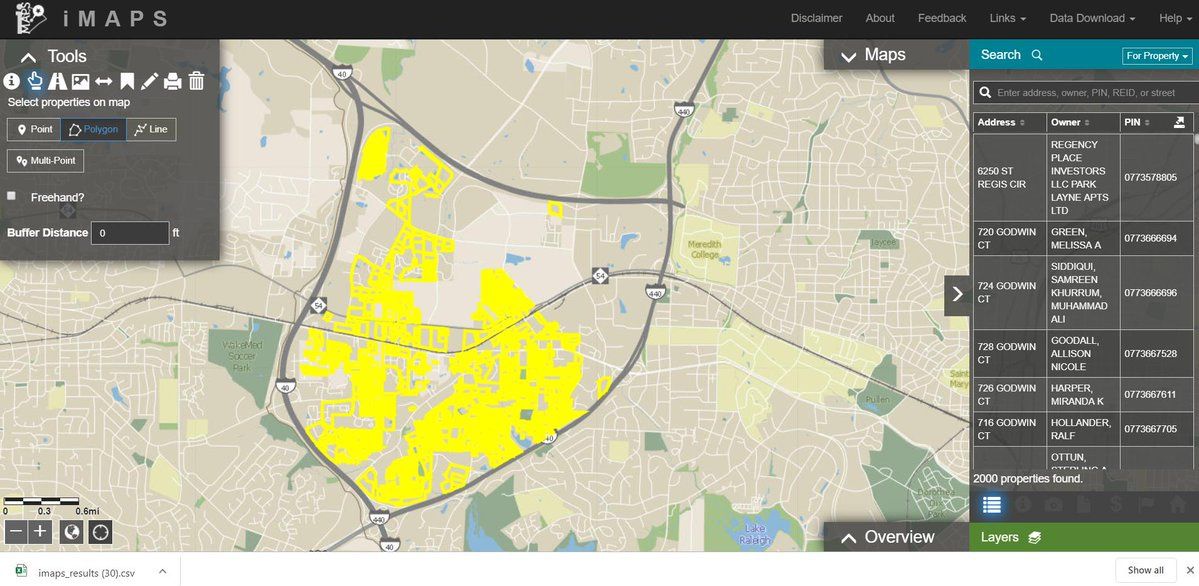
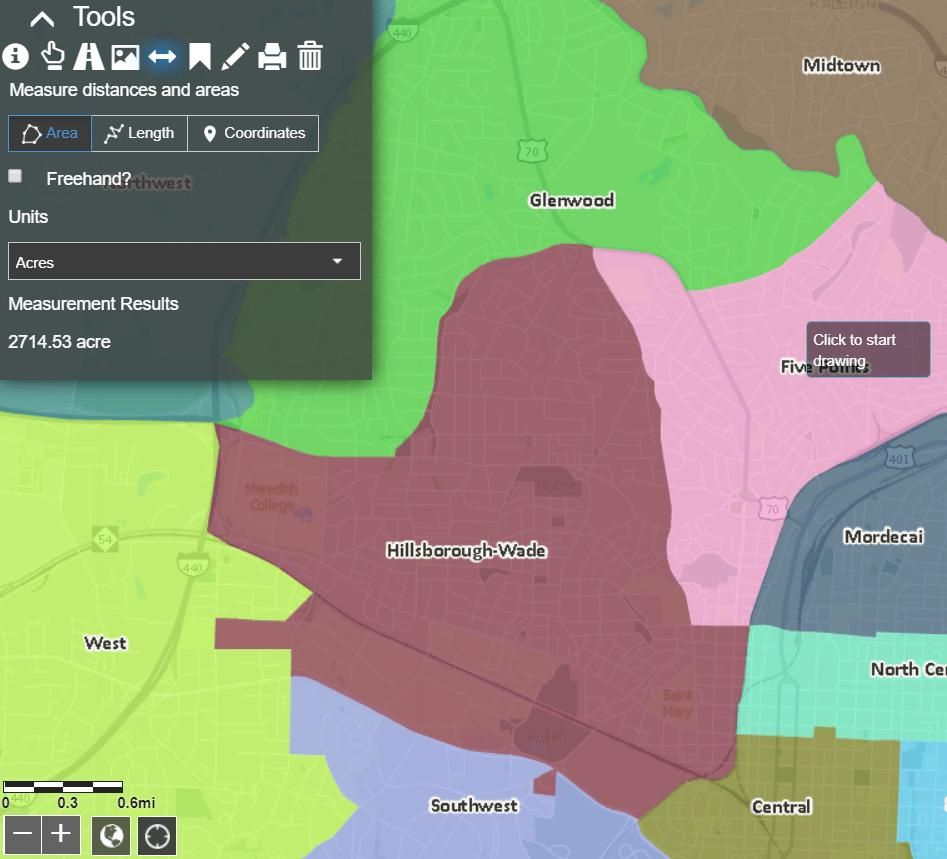
From “tools” I have been using “Measure” & “Select”. For measure you draw around an area & measure acres for instance. The area I took a look at for this example thread has a little over 3,730 acres.
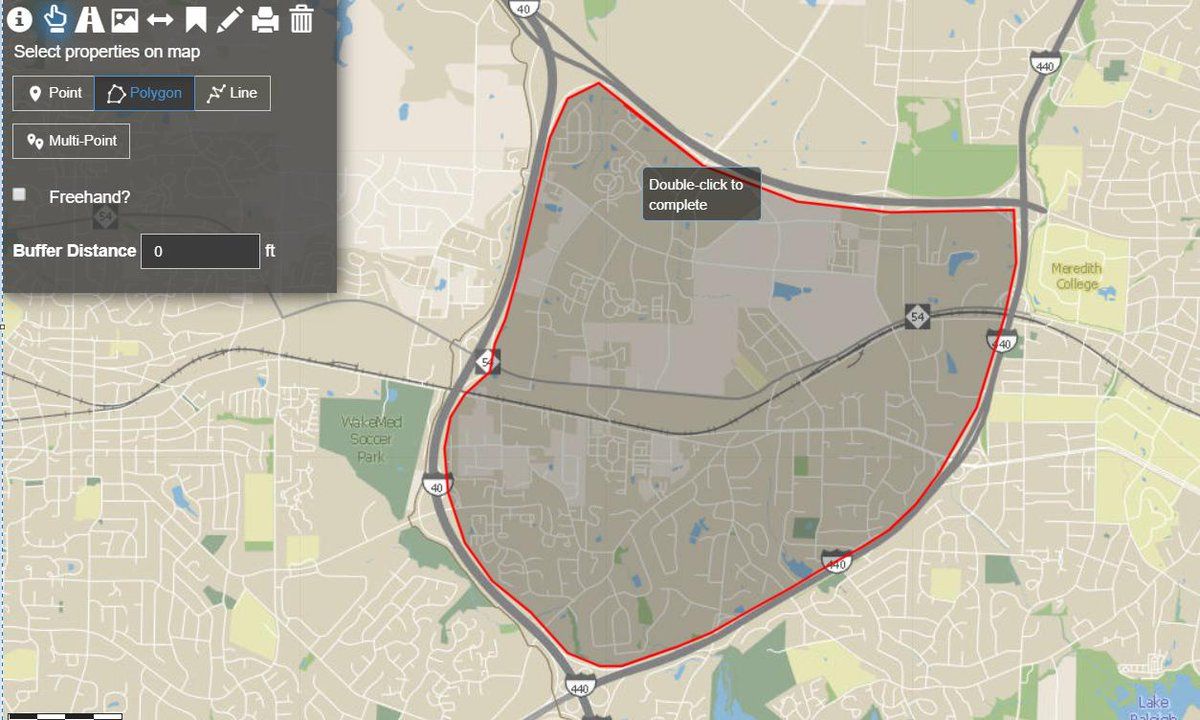
“Select” is similar but has a different outcome. You make a drawing around an area then double click to select all the properties in there. However, I found that you can only select 2,000 properties at a time. This area has more than that.
This was a huge pain in the but for me. I would have to essentially cut the CAC into a few sections, make sure to draw areas that did not overlap & pull & put all the data together. Not doing that today, just taking the data that comes up.
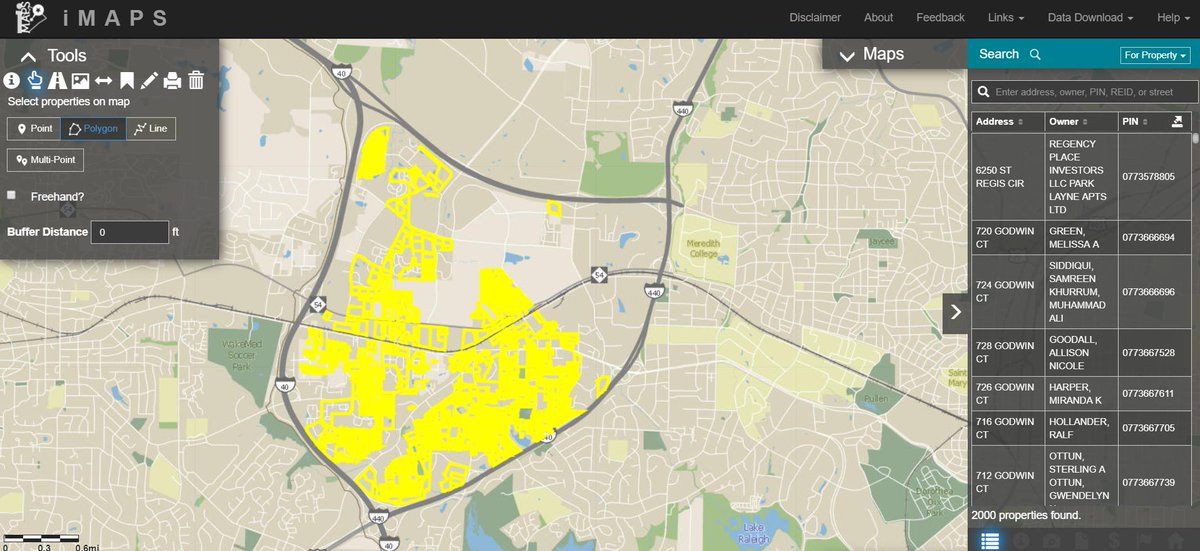
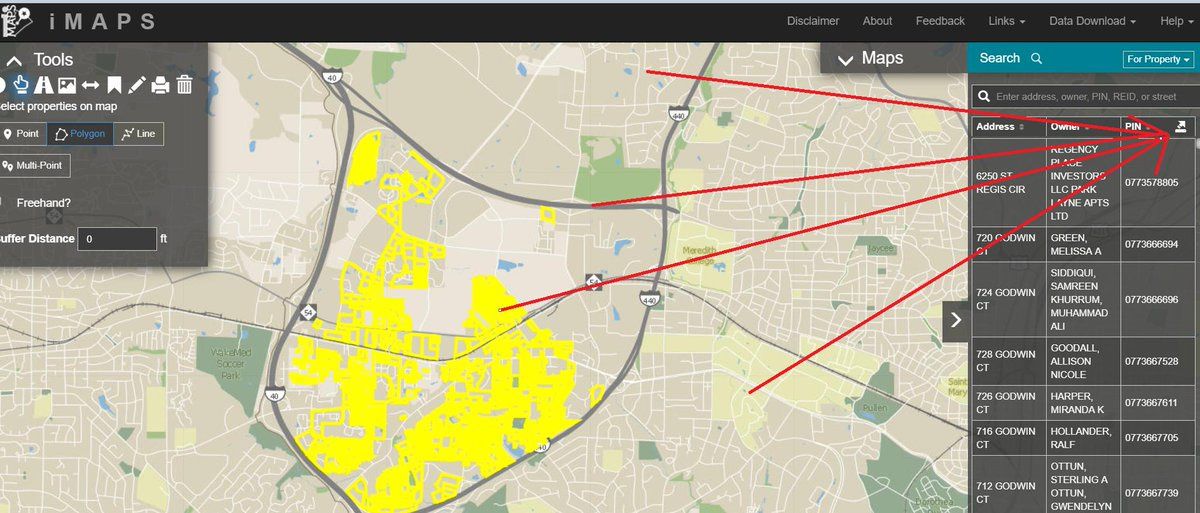
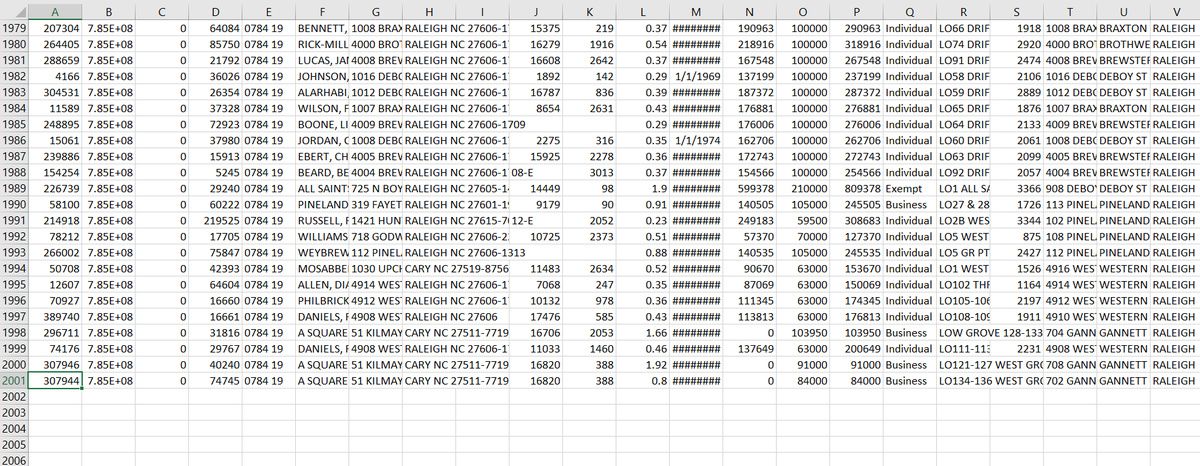
So once you have selected an area you can see all of those “yellow” properties as having been selected. Then on the top right of the “search” panel there is a button to export. I click that. A file exports (bottom left), click on that & you get a CSV.
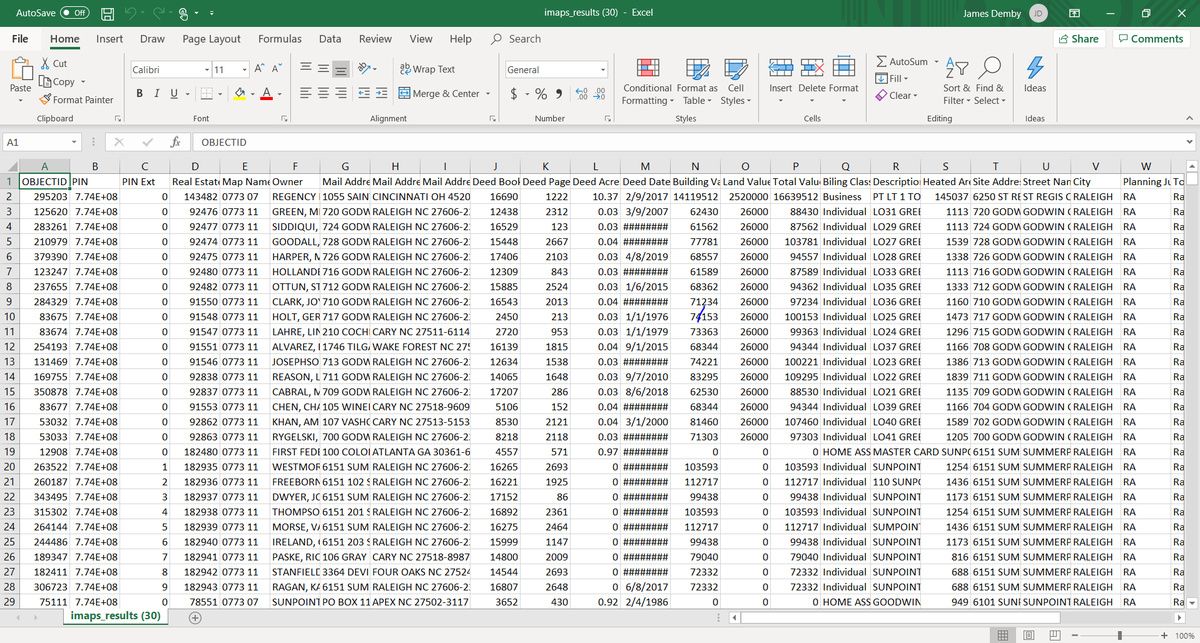
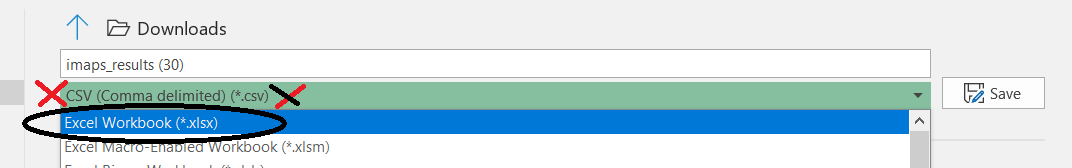
I would use pivot tables in excel to sort the data, & remember to save the doc as an Excel doc and NOT A CSV! All your sorting and tables will not get saved! Like I said the data only goes to 2,000 records.
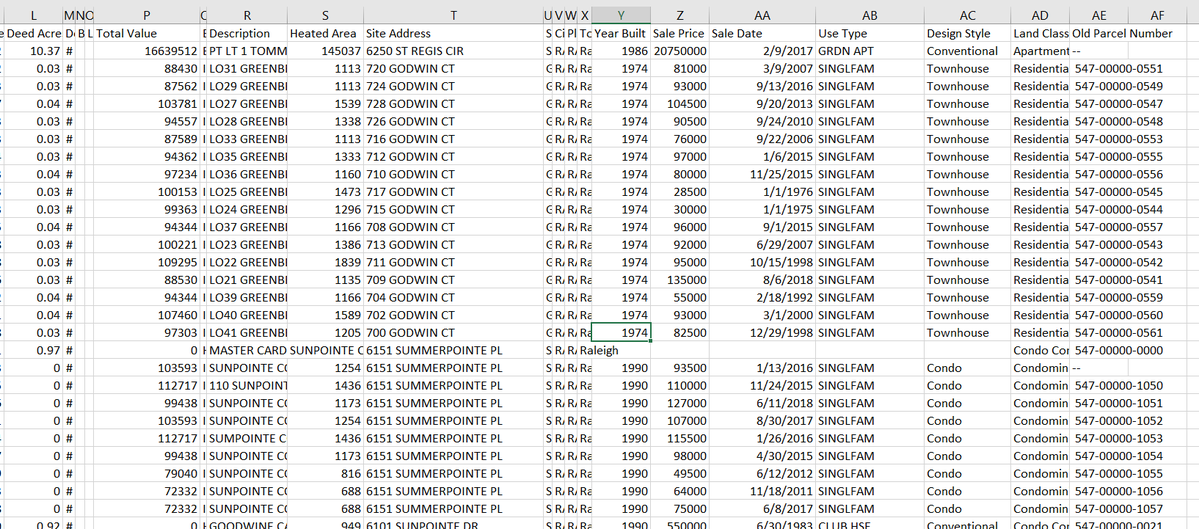
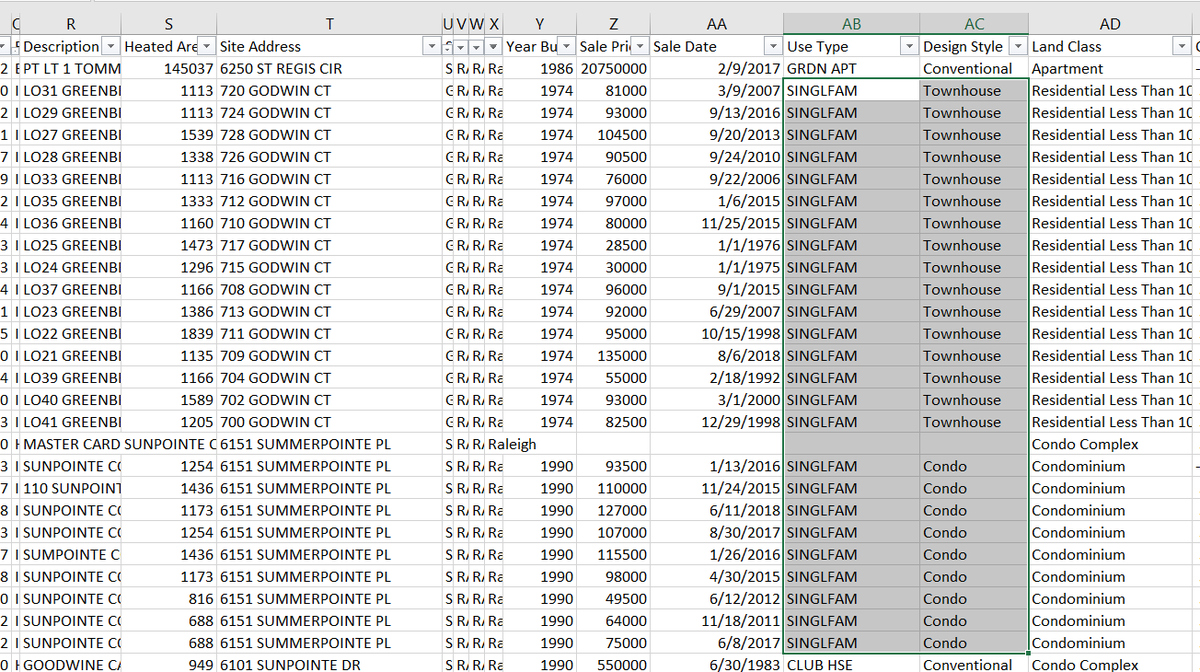
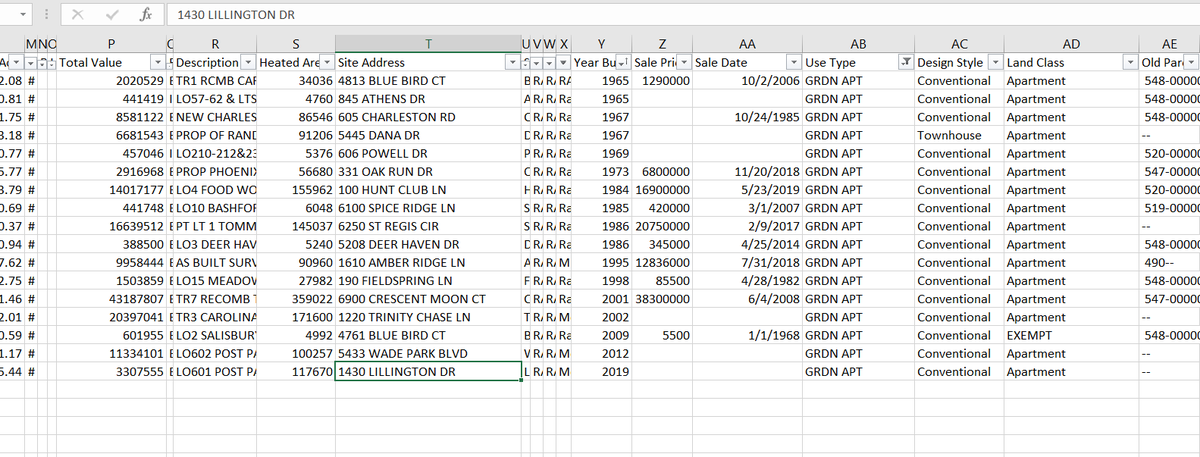
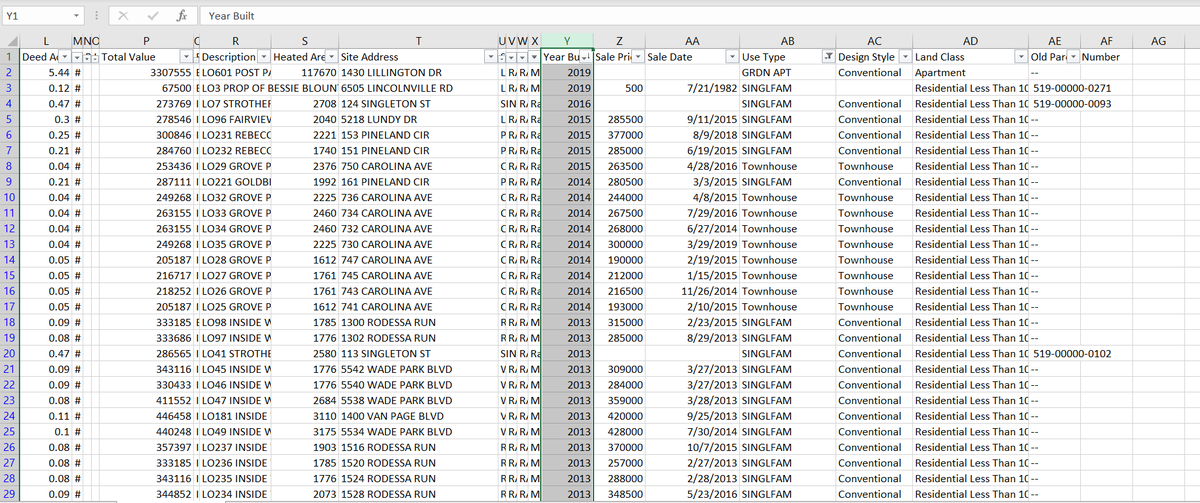
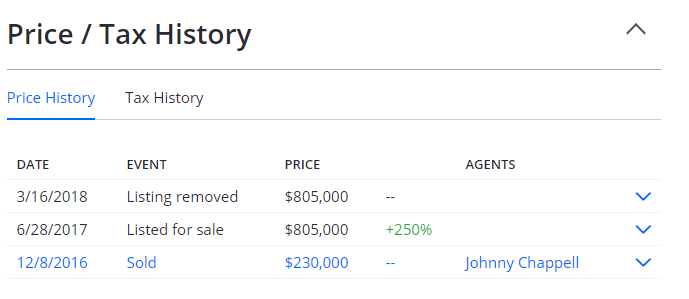
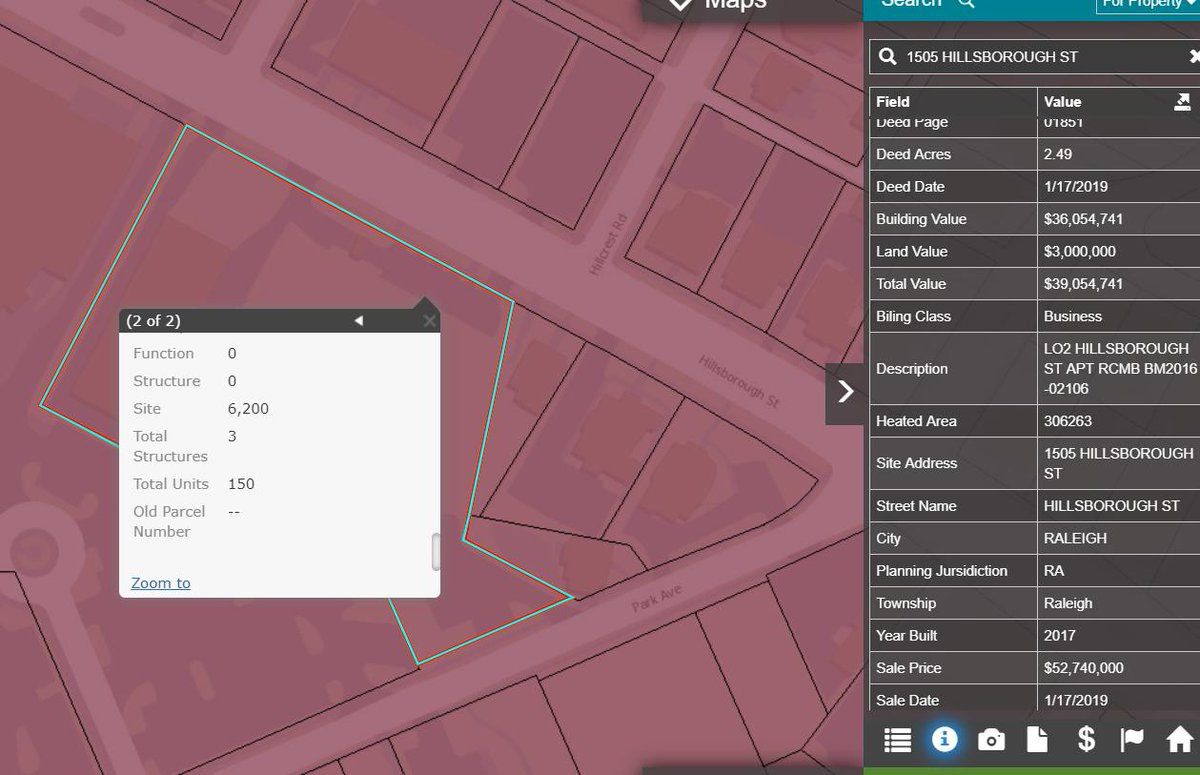
There are a few columns I found helpful. “Deed Acres” = How much land, “Total Value”= Properties Taxable Value, “Heated Area” = Square Footage inside, “Site Address”, “Year Built” = how old, “Sale Price” = last sold price, “Sale Date” = last sold on, “Use Type” = Type of building
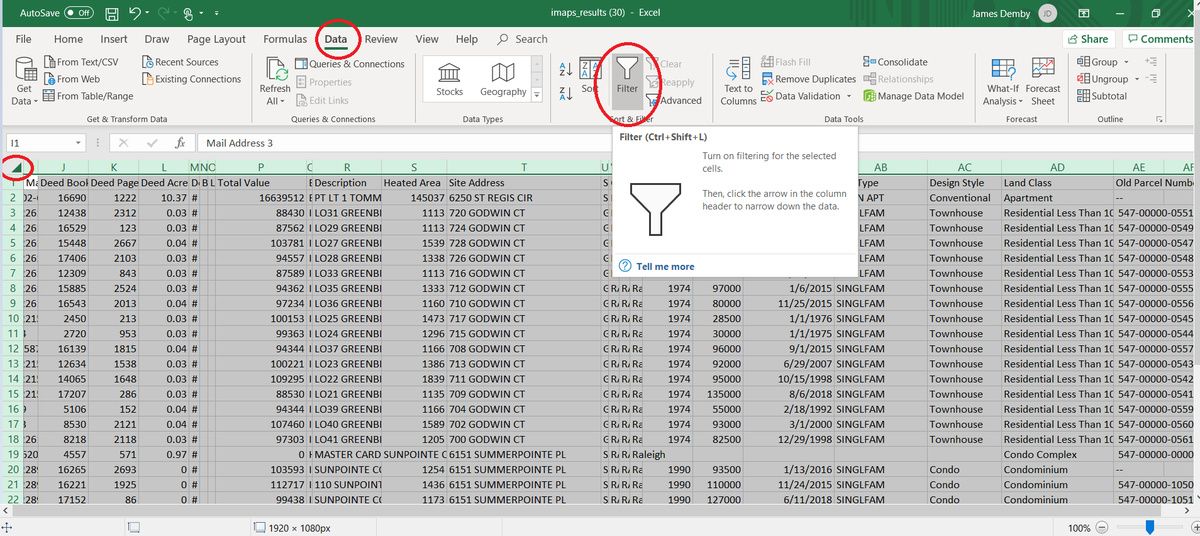
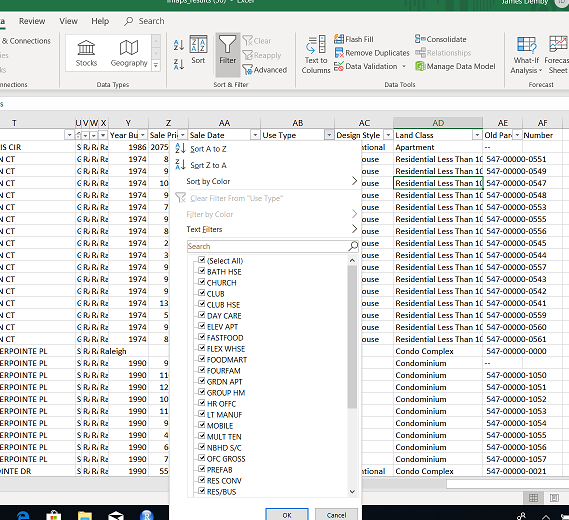
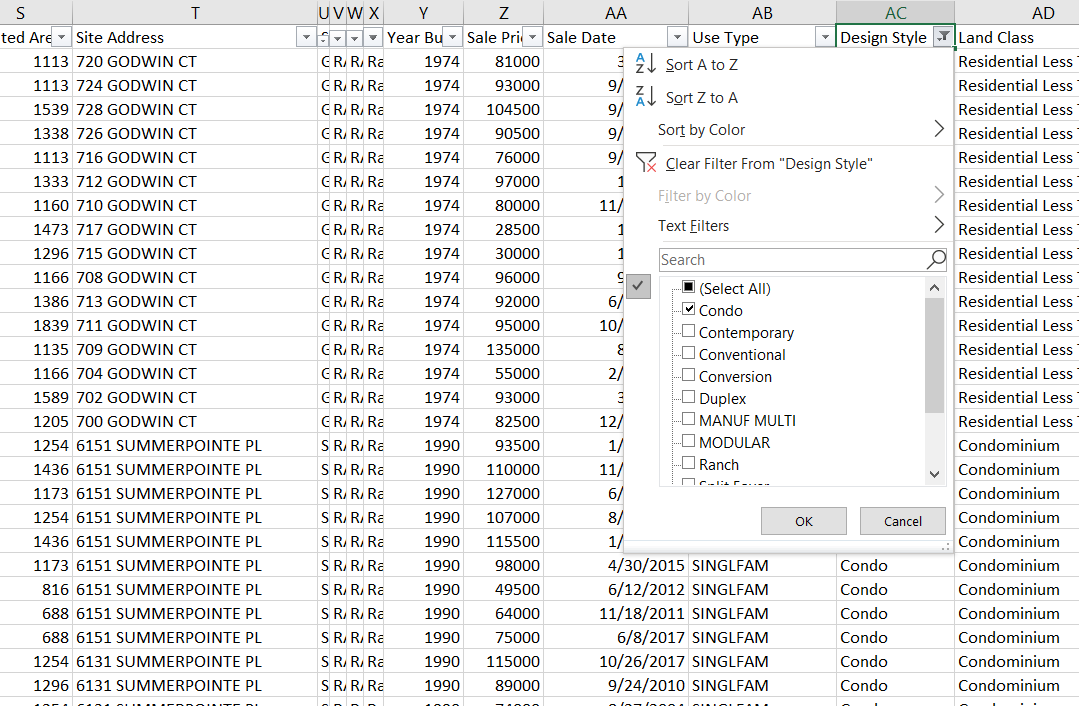
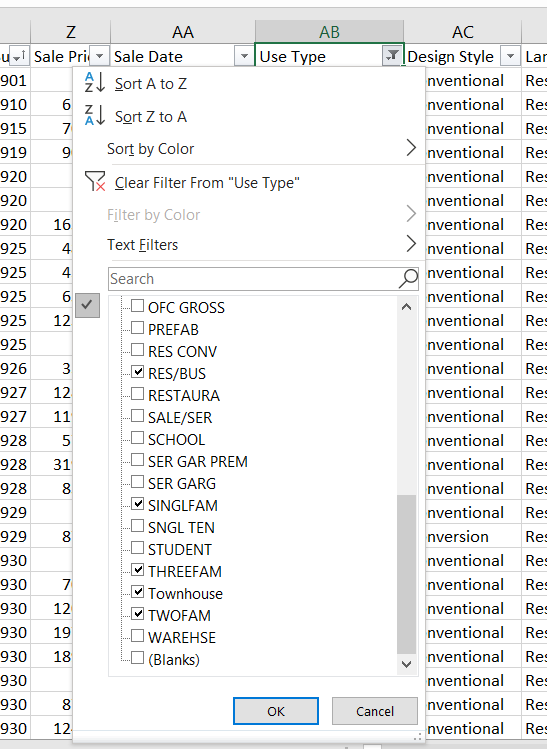
There are lots of use types, to I would sort those for residential. Press the little triangle in the top left, then click “data” ->“Sort”. This give a little triangle next to use type that you can select to then sort by use type of select on certain ones.
One thing I noticed was that Condo’s & Townhomes are “SINGLFAM” in use type. So I would go in an change it from SINGLEFAM to Townhome and Condo use type based on the “Design Style” column.
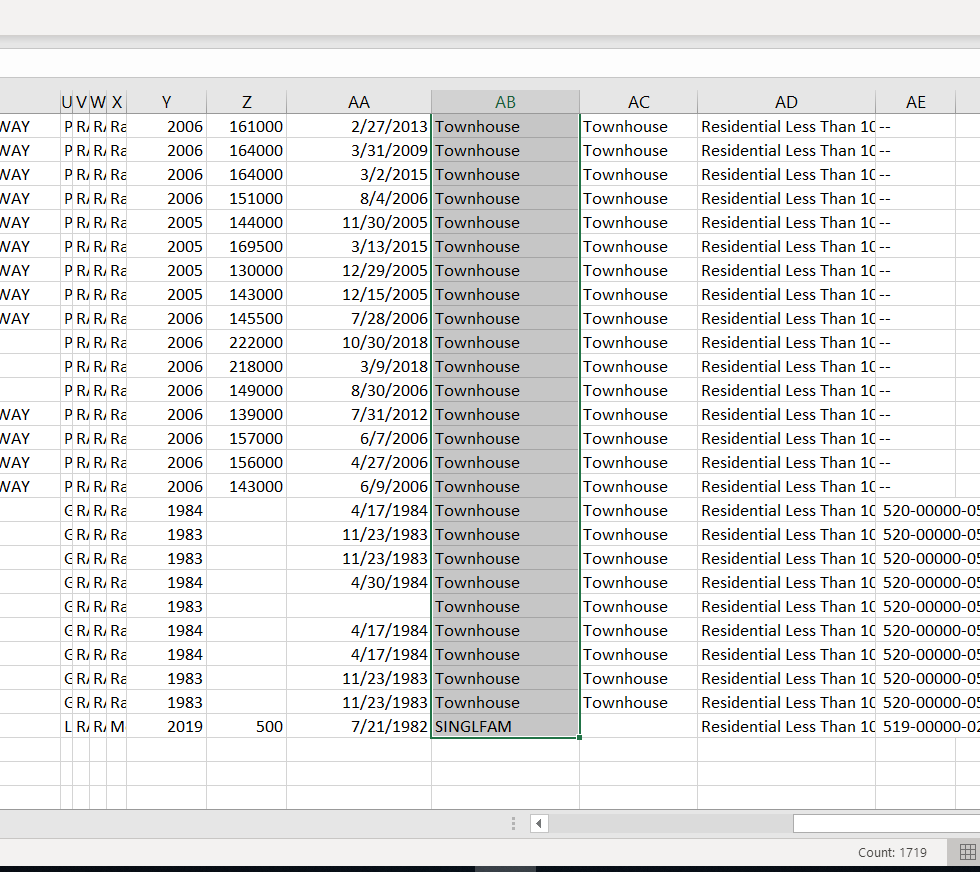
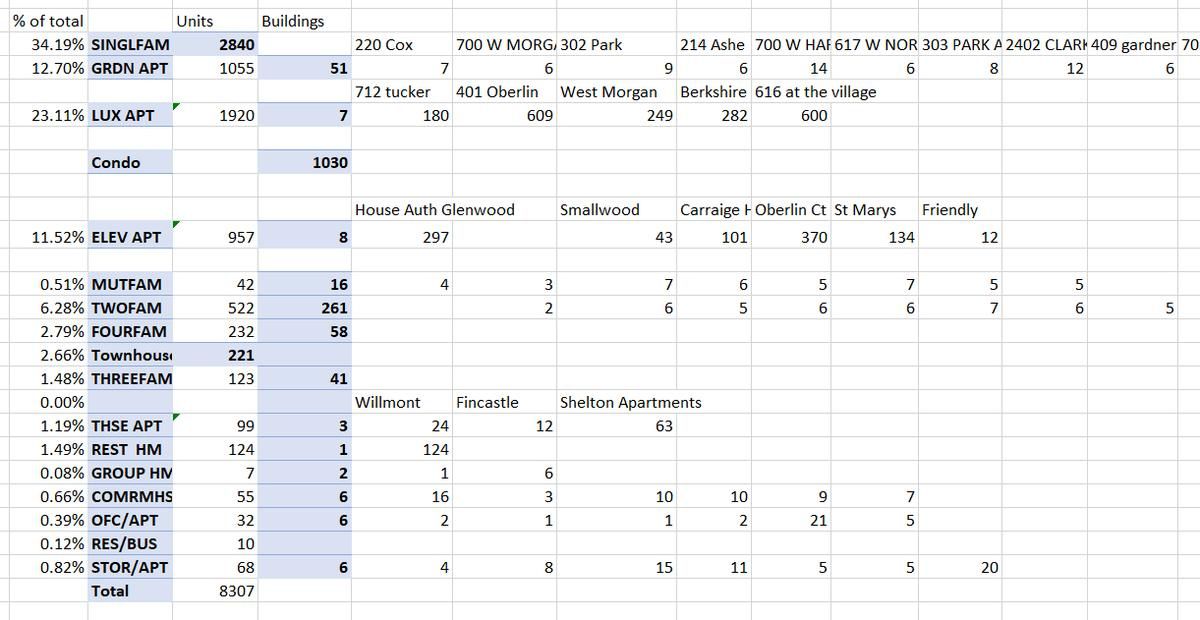
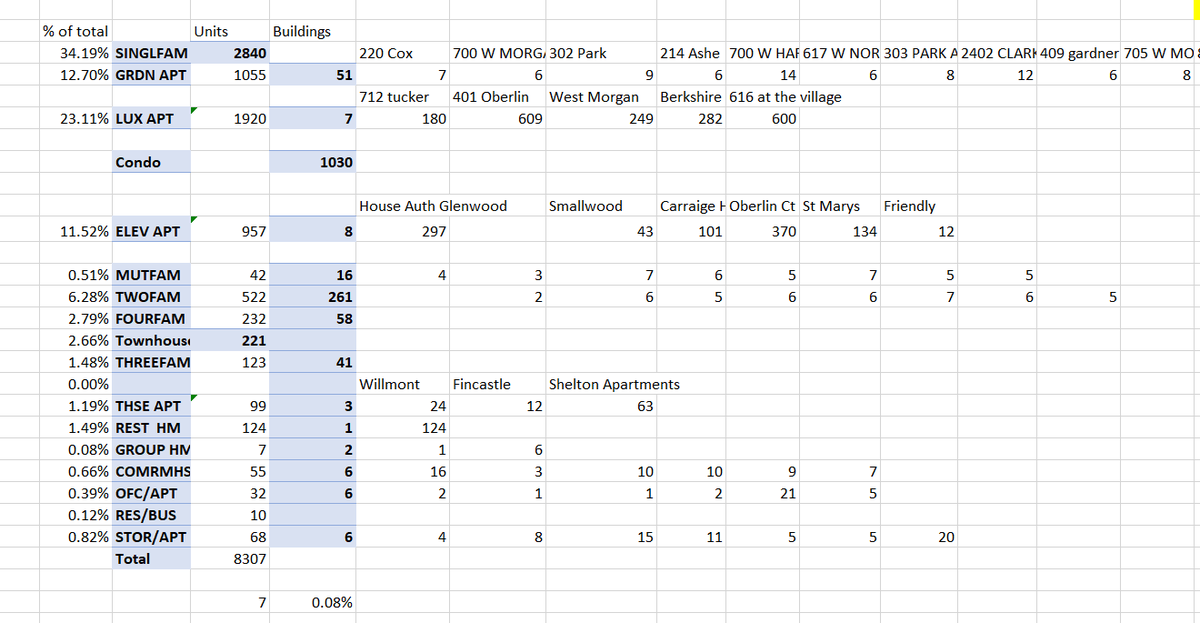
For instance in this data, I selected just “townhomes” and “condos” from Design Style and it gave me 726 results. So of that 2,000 properties 726 are condo or townhomes. Sorry if this is becoming Excel 101. Of those 2000 properties 1,700 were residential of some form.
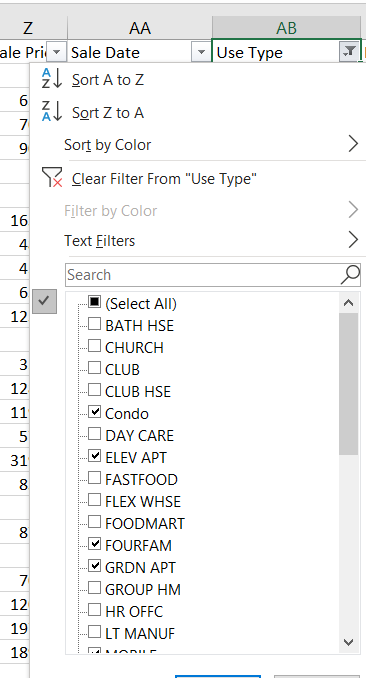
The things I would select for residential are “Condo”, “ELEV APT”, “FOURFAM”. “GRDN APT”, “REV/BUS”, “SINGLEFAM”, “THREEFAM”, “TOWNHOUSE”, and “TWOFAM”
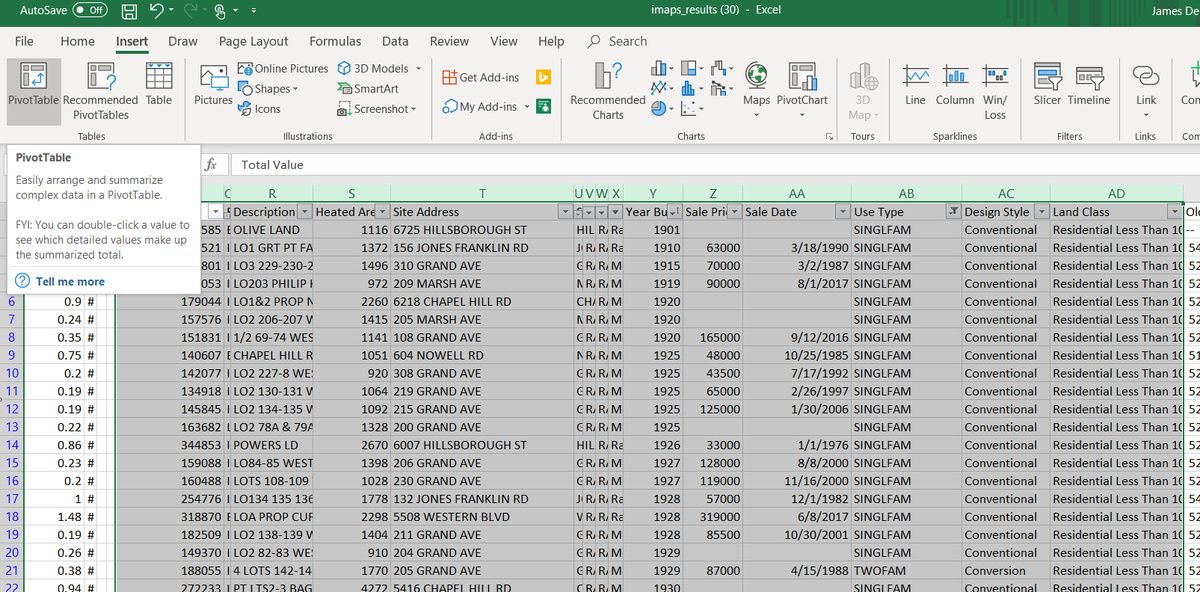
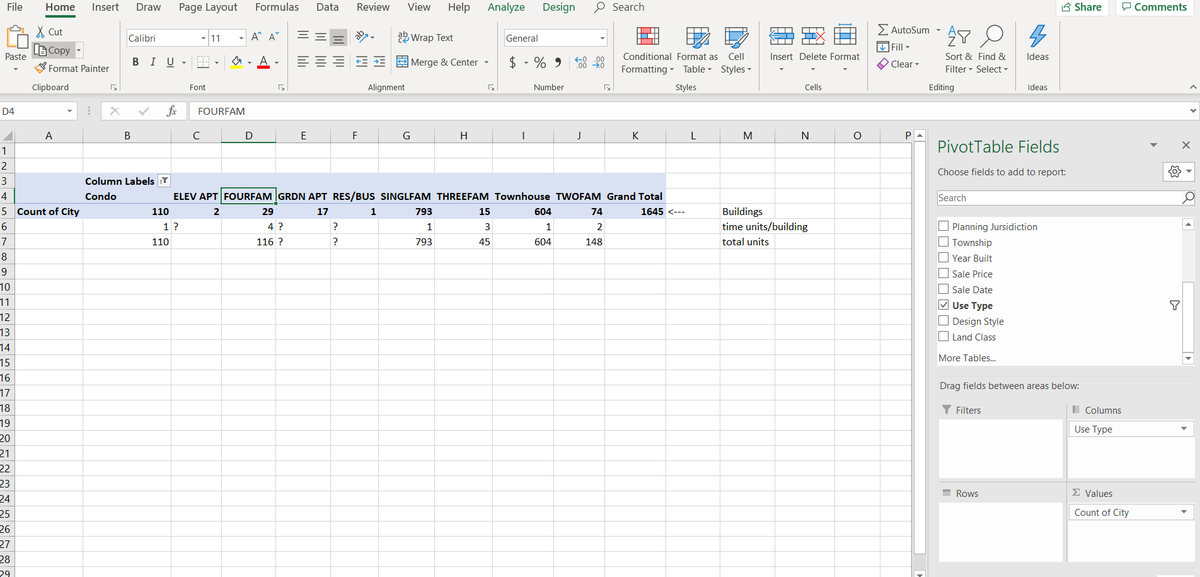
Then I would make a pivot table based on the use type. Select all of the columns from total value through use type, & insert pivot table. For the pivot table, put “use type” in the column & “count of city” in the values part. You will need to sort out the use types again.
Some of the use type like a “FOURFAM” are easy. Just multiple the building count by 4 to get the total. For “GRDN APT” or “RES/BUS” you will need to look each building up to find the units.
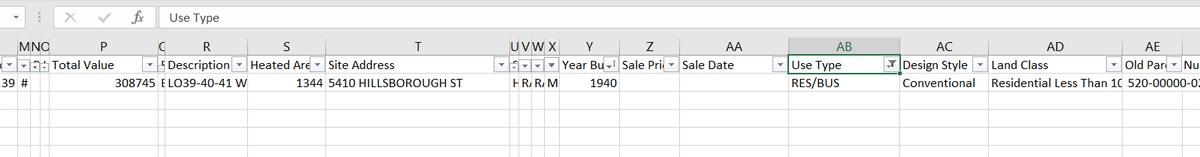
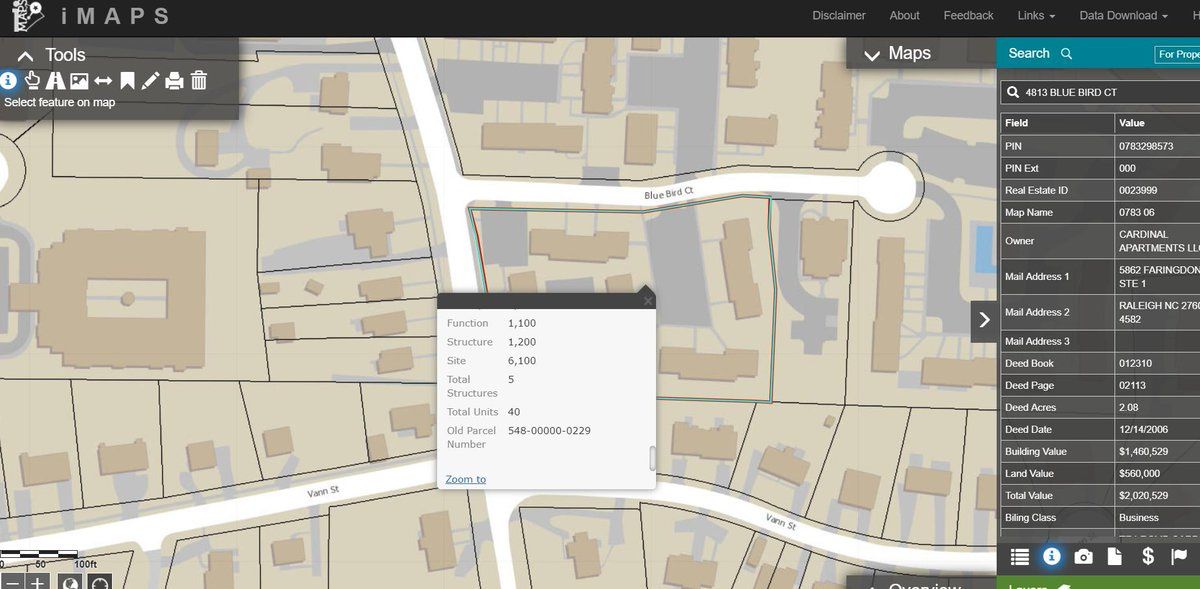
As an example, I would go back to the data, filter for just “RES/BUS” ← I think this is Residential and Business? To find the address. Then put that in Imaps, select the property, & scroll down for units. This one says 1 unit.
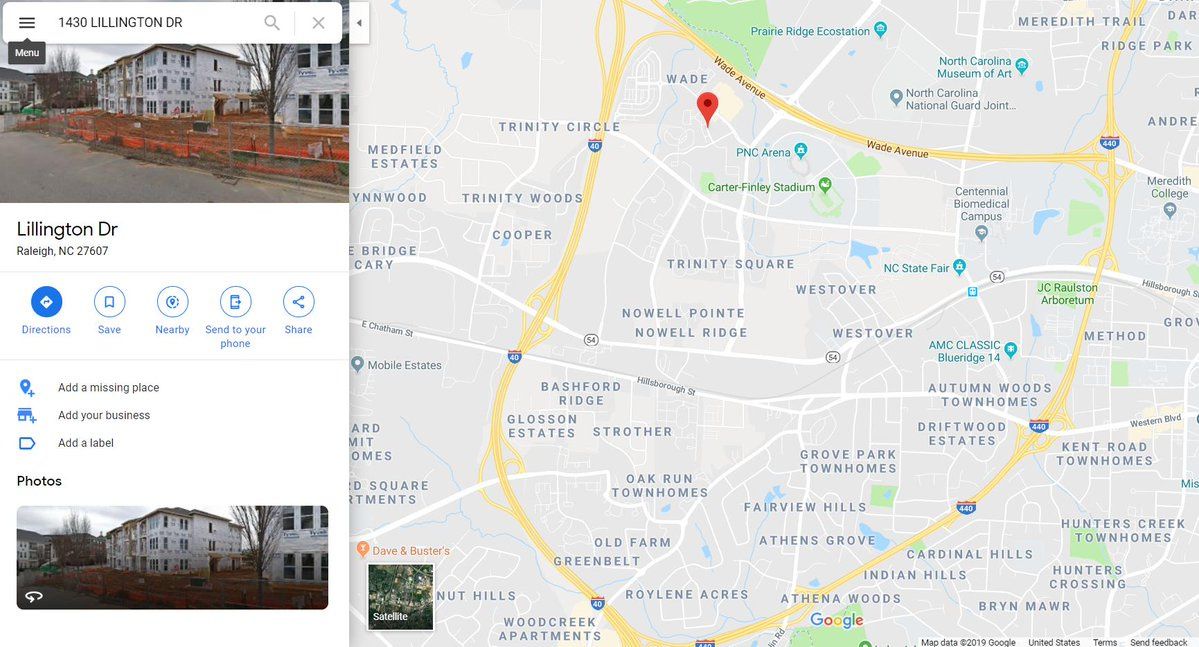
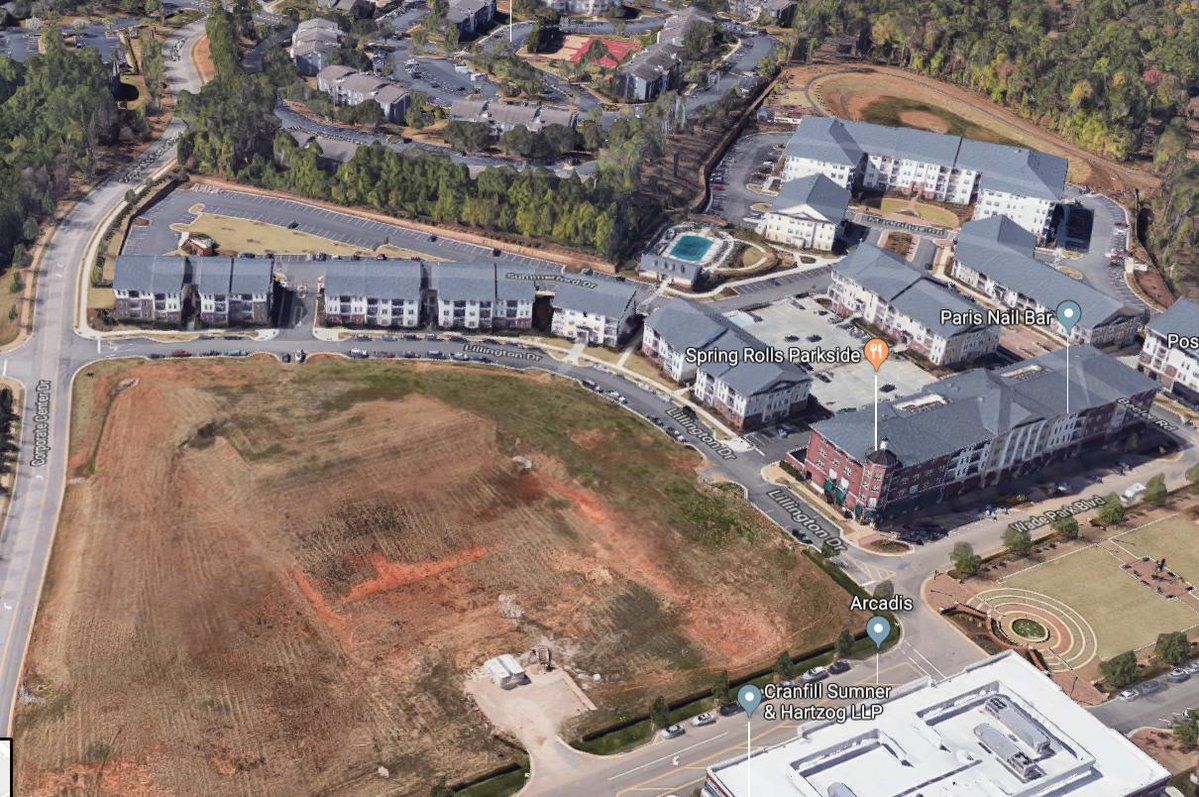
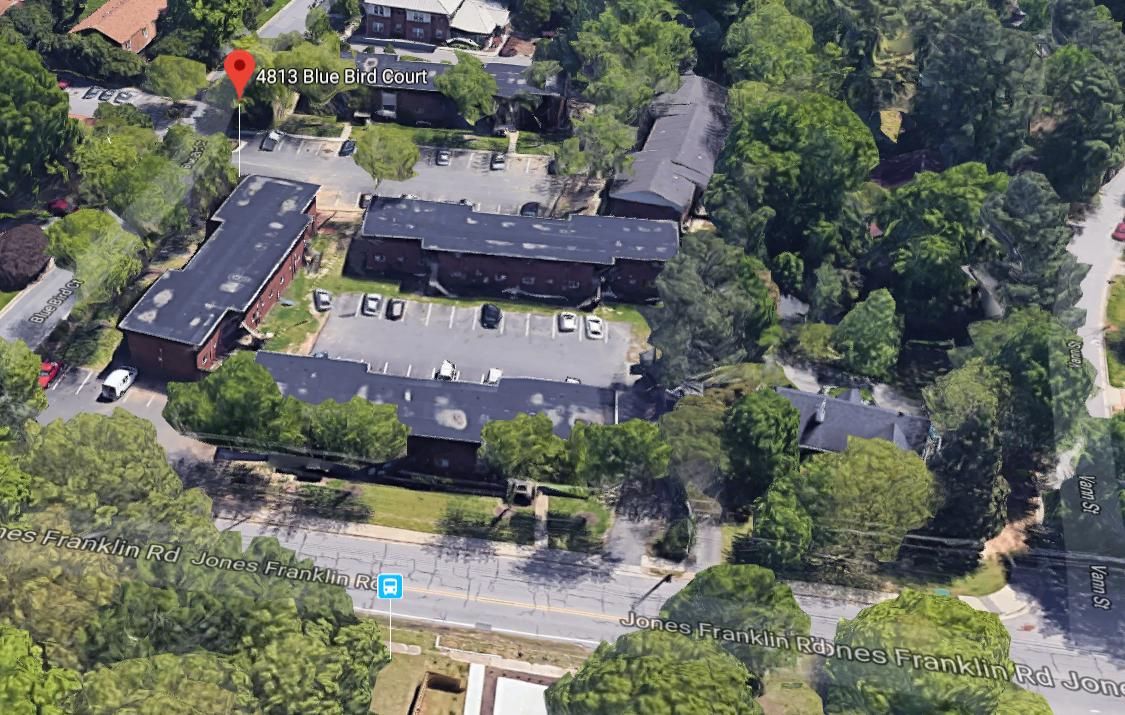
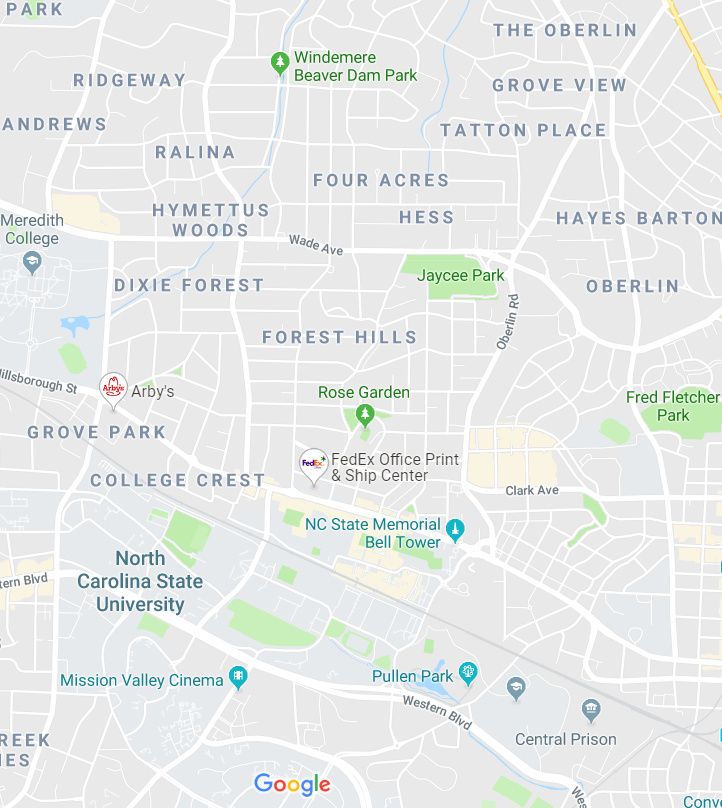
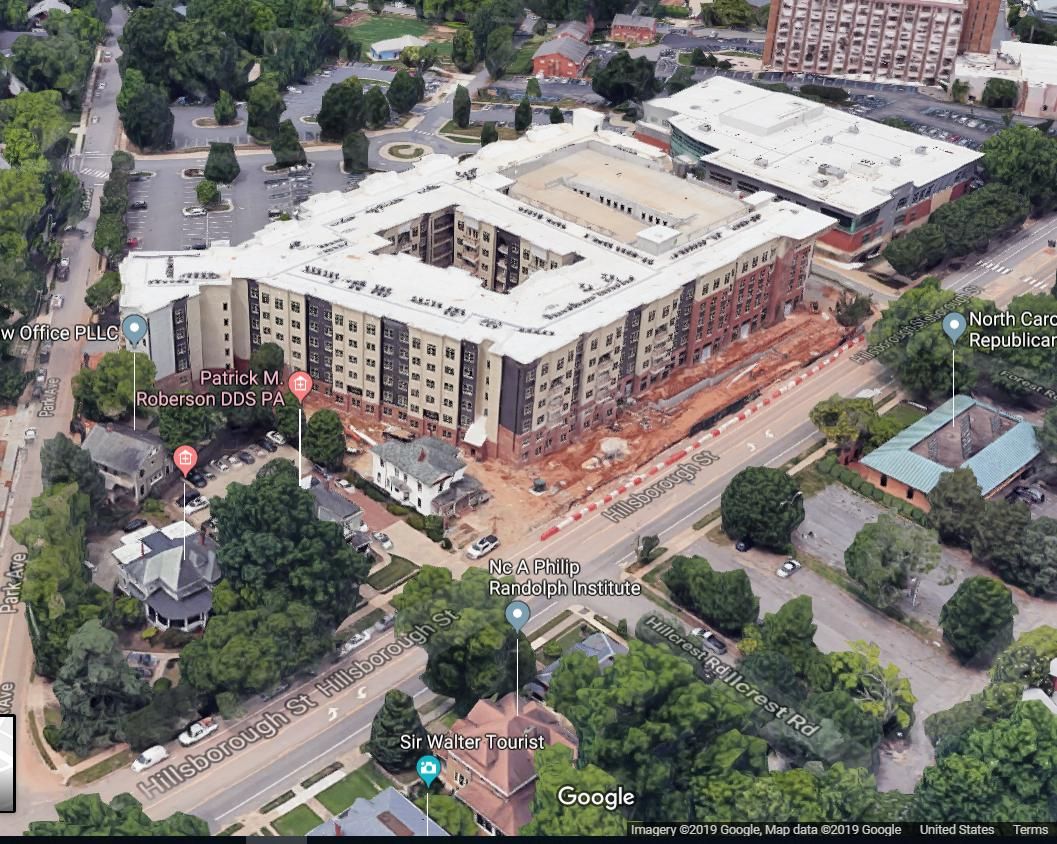
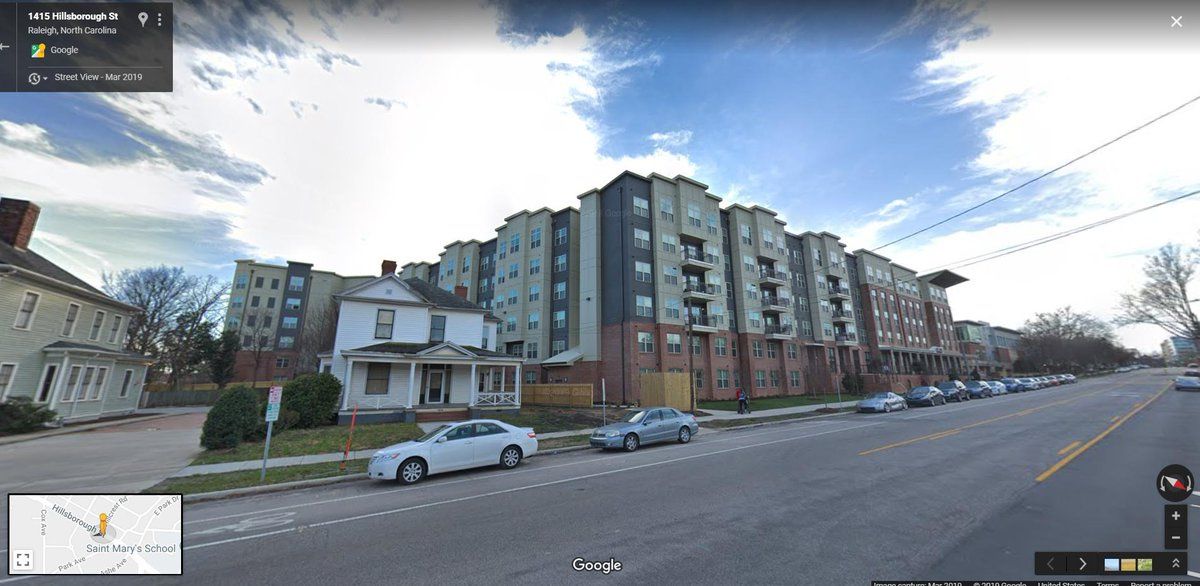
When I do this for Garden Apartments I see that one was built in 2019. So not 2018, but on the way. Googlemaps says it is near PNC arena, I maps says that land is getting 150 units. I wonder if that will all finish in 2019 though.
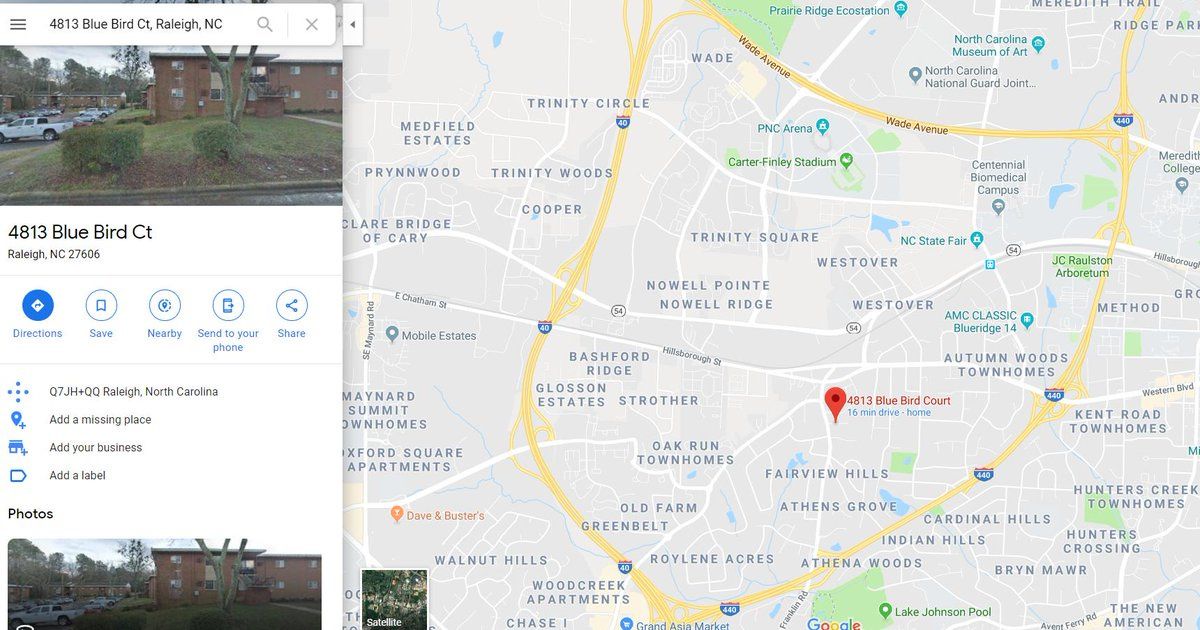
The oldest Garden Apartment shows as on Blue Bird Court & Imaps says it has 40 units. This is just to give an idea of how to find out what is on the ground in an area.
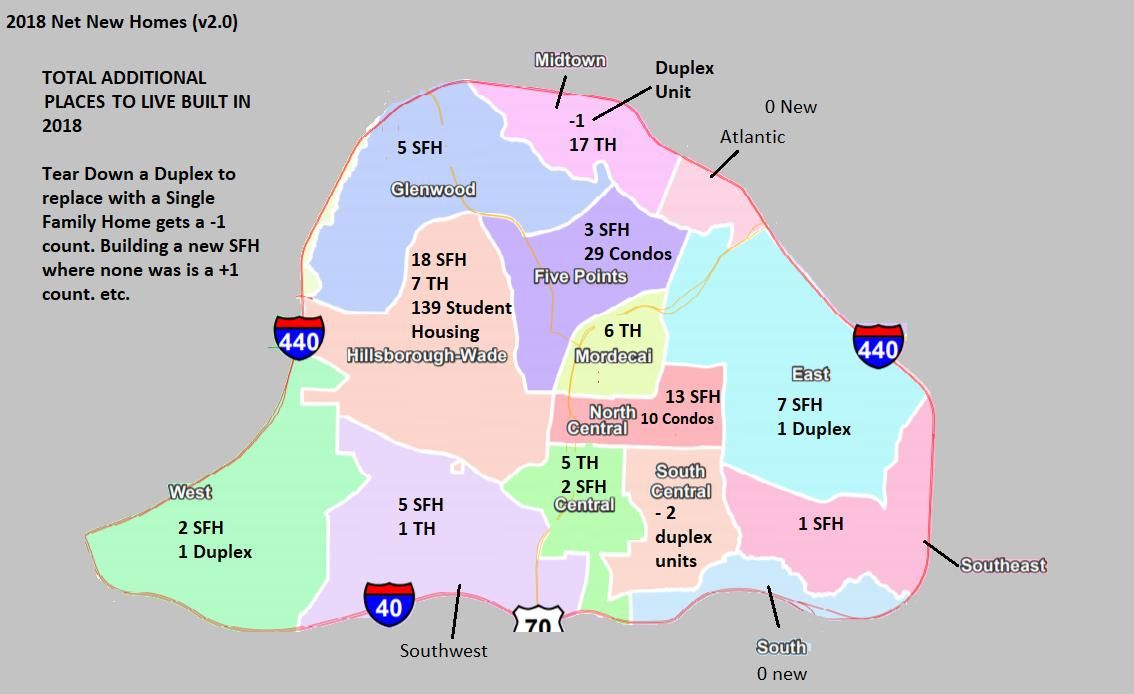
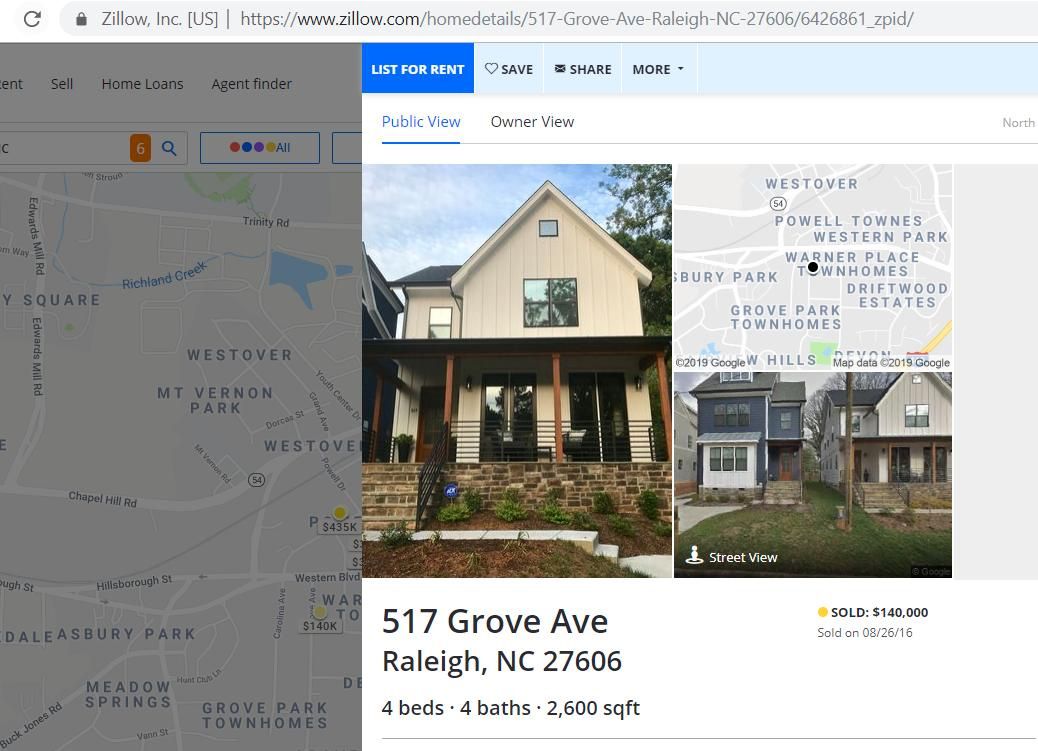
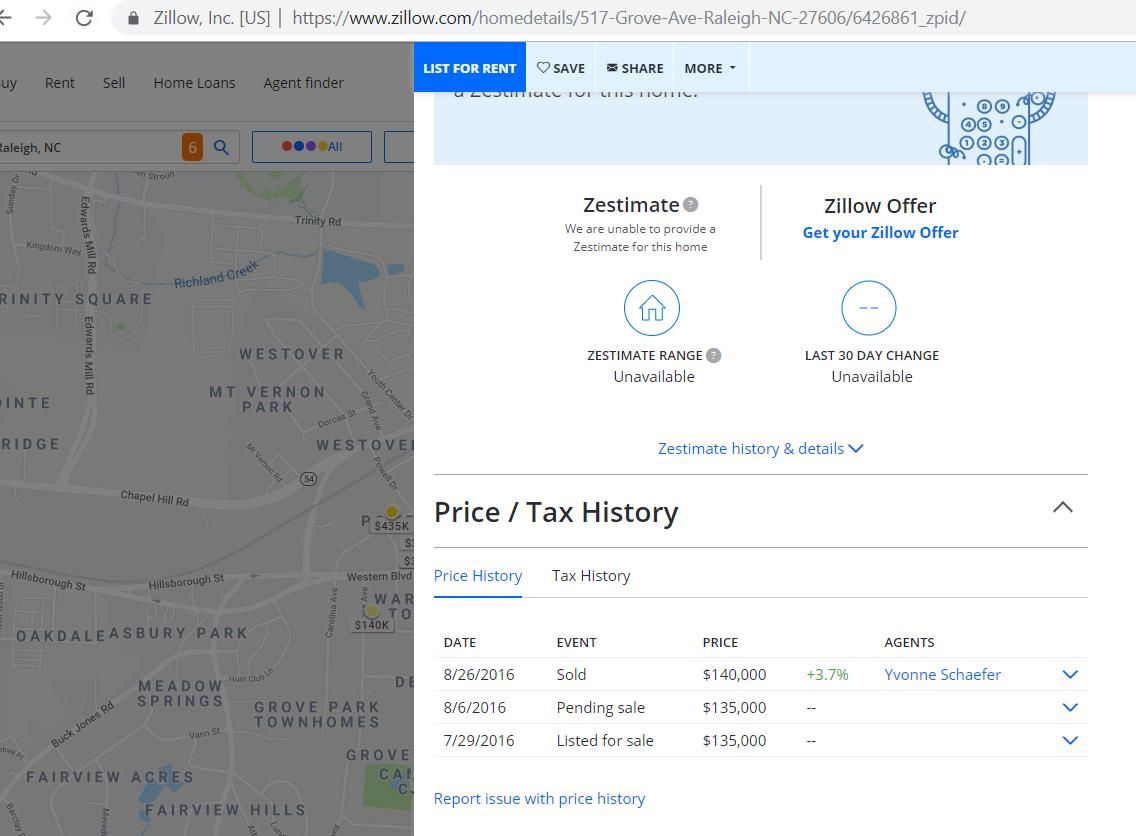
I use those numbers to get the units in the area and them compare the new stuff to get a % of growth. To look for new units, filter just residential type and sort by year. Of those 1700 residential, none built in 2018. The ones in zillow must not have made the 2000.
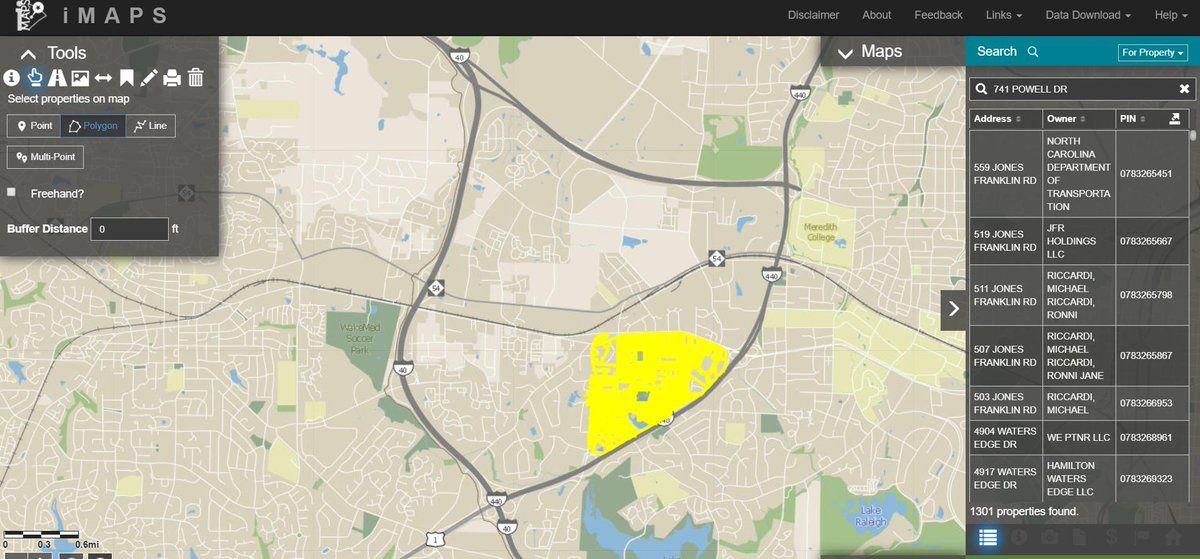
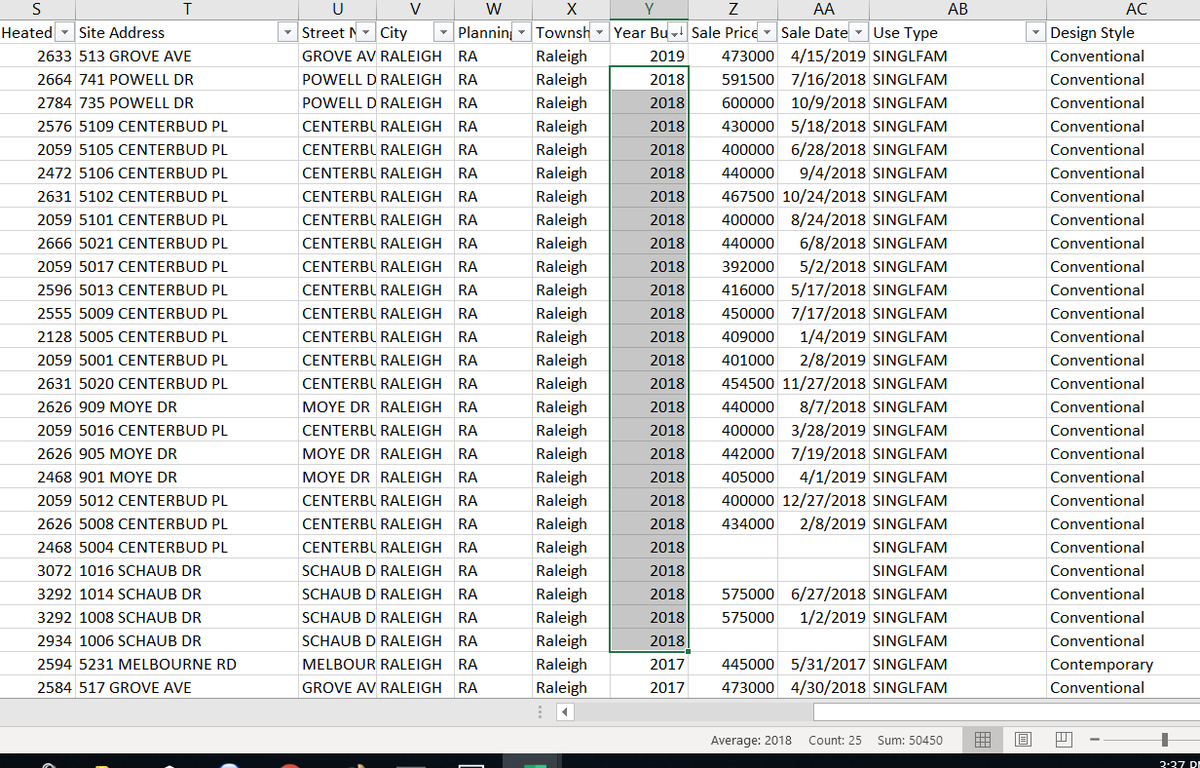
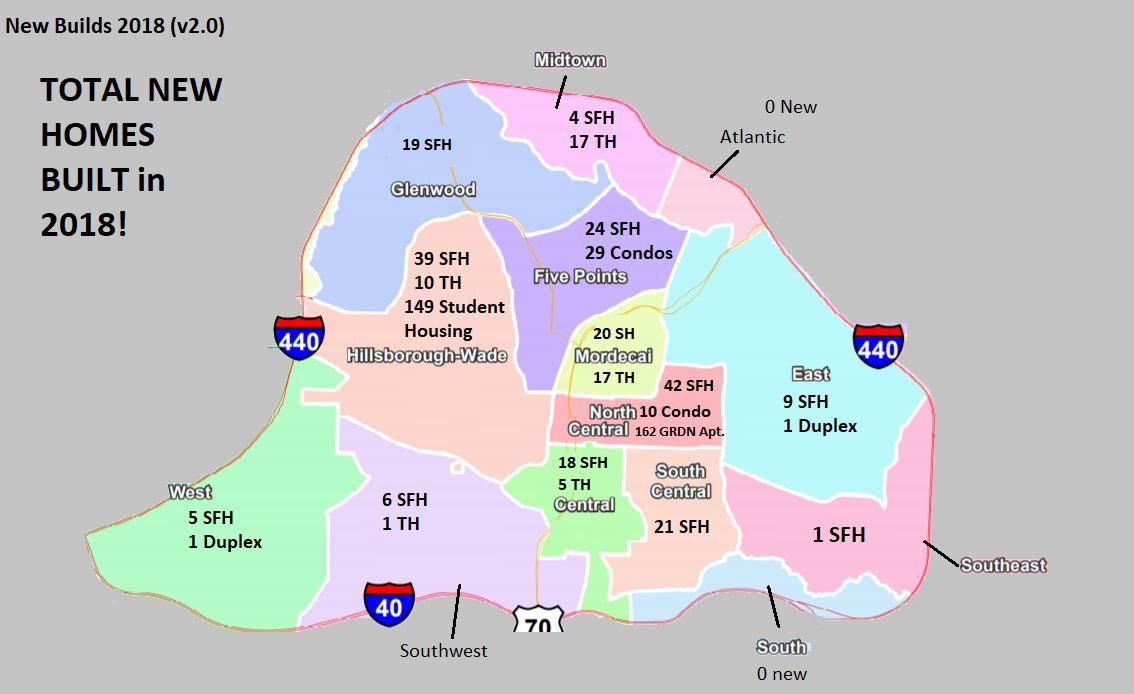
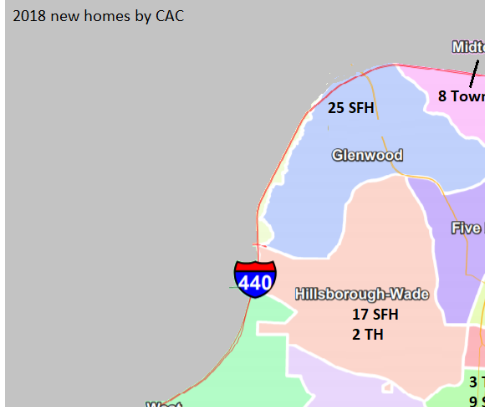
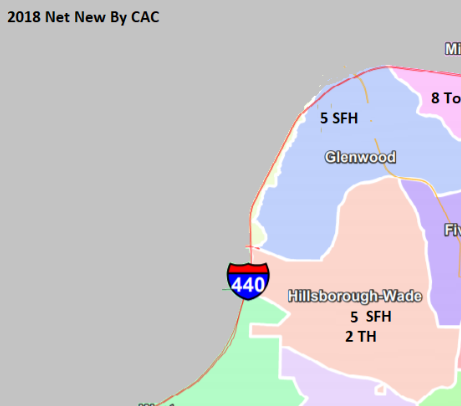
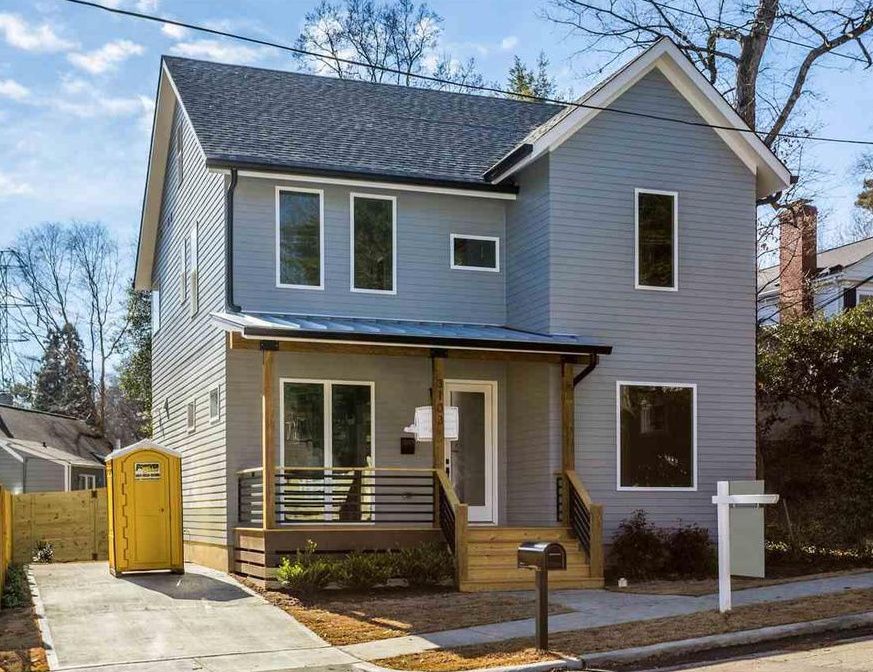
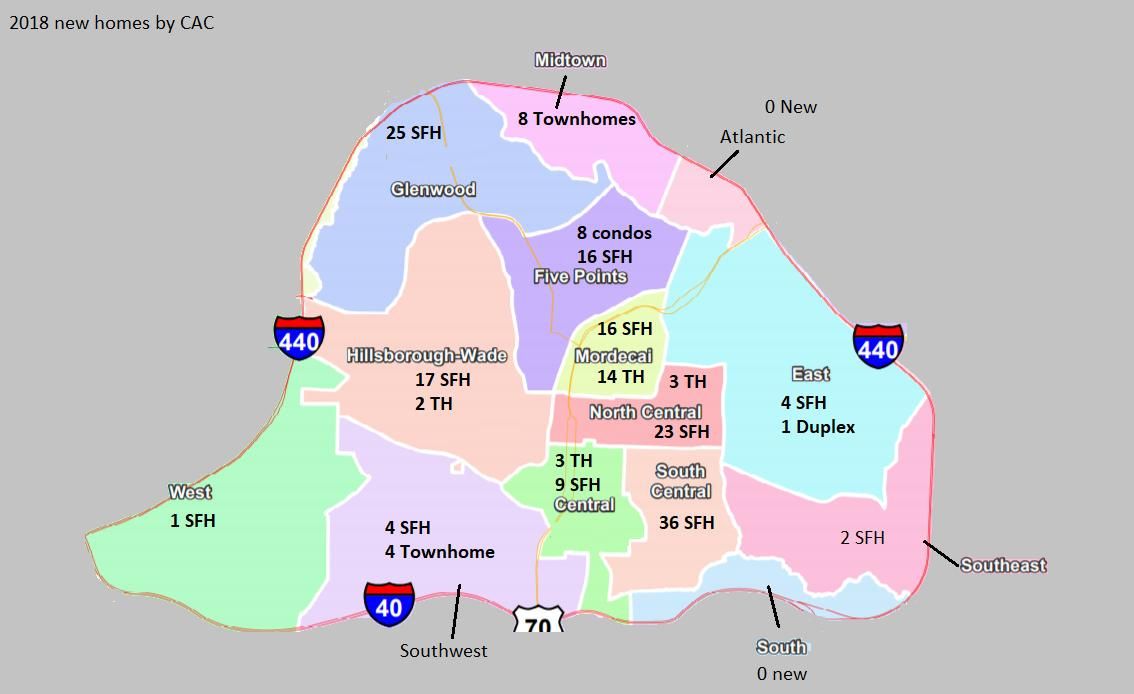
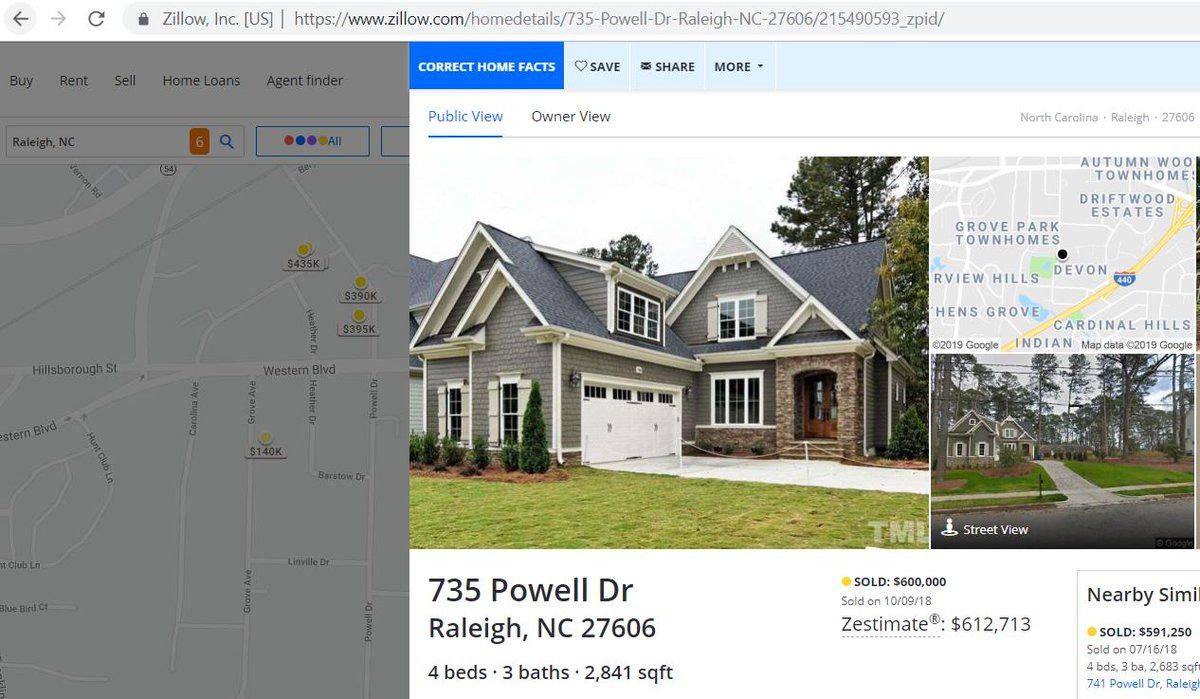
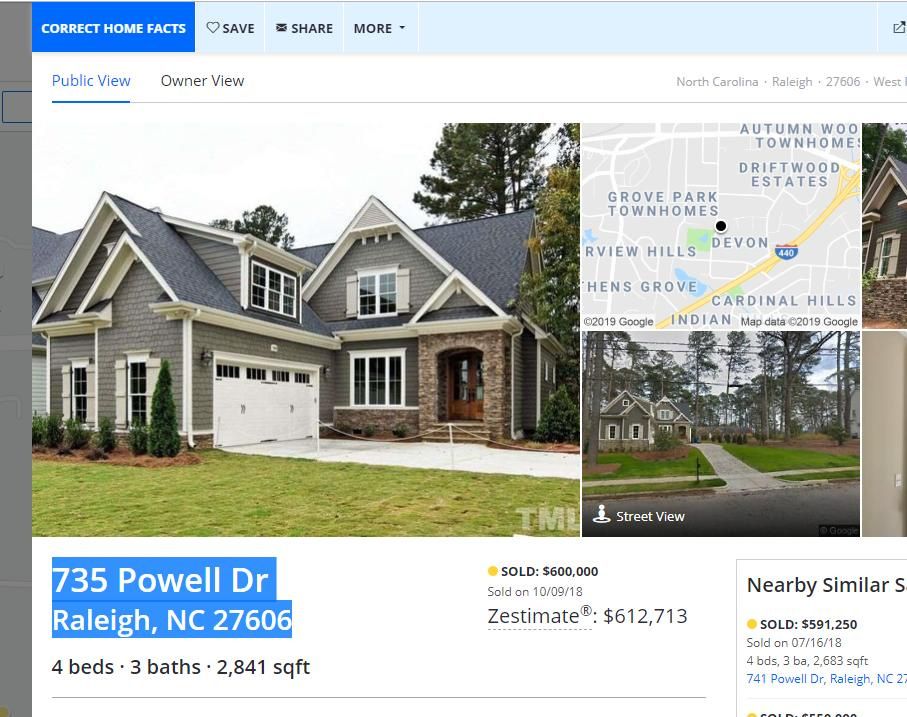
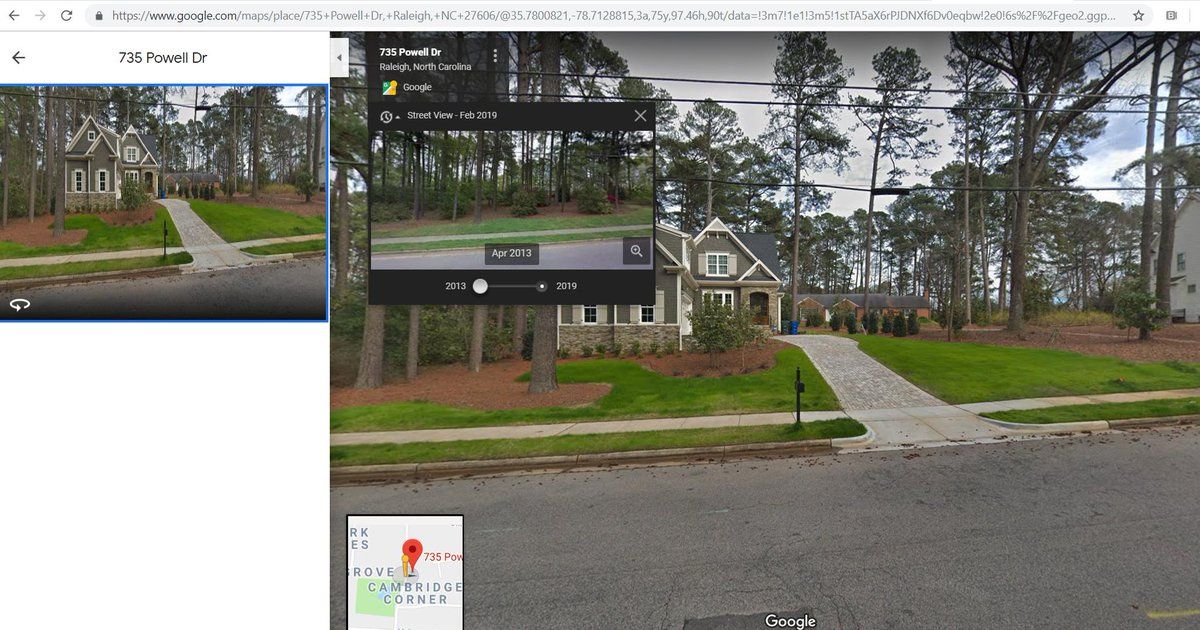
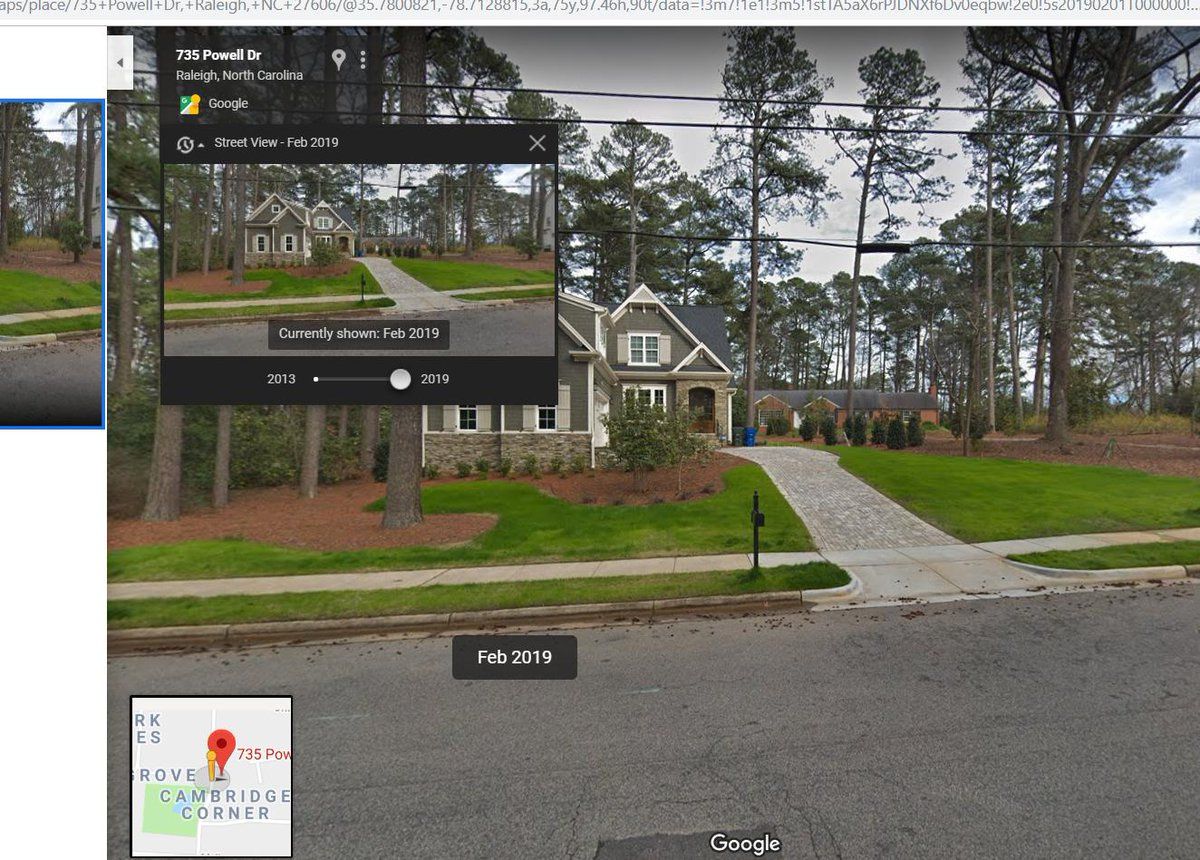
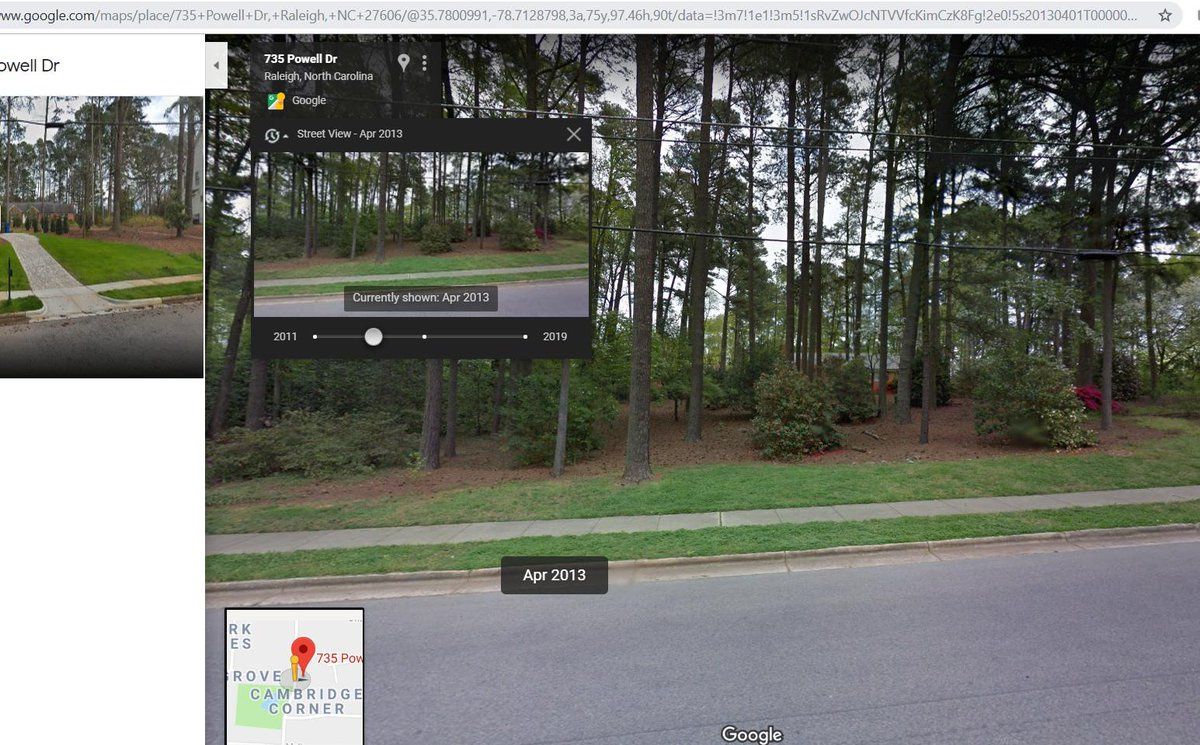
I will grab just the data from around that house on Powell to show an example of how the data from imaps can give the best picture of new homes from a year like 2018. Just this little portion had 1300 properties. Of those 25 were new Single Family Homes.
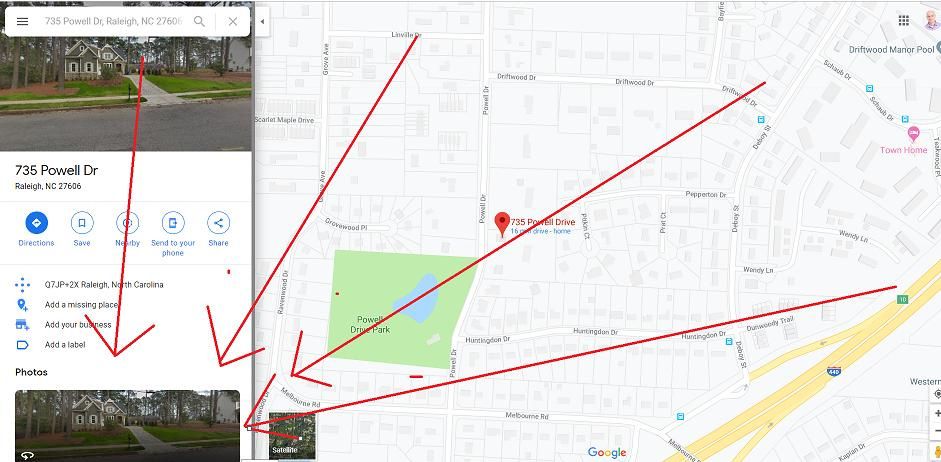
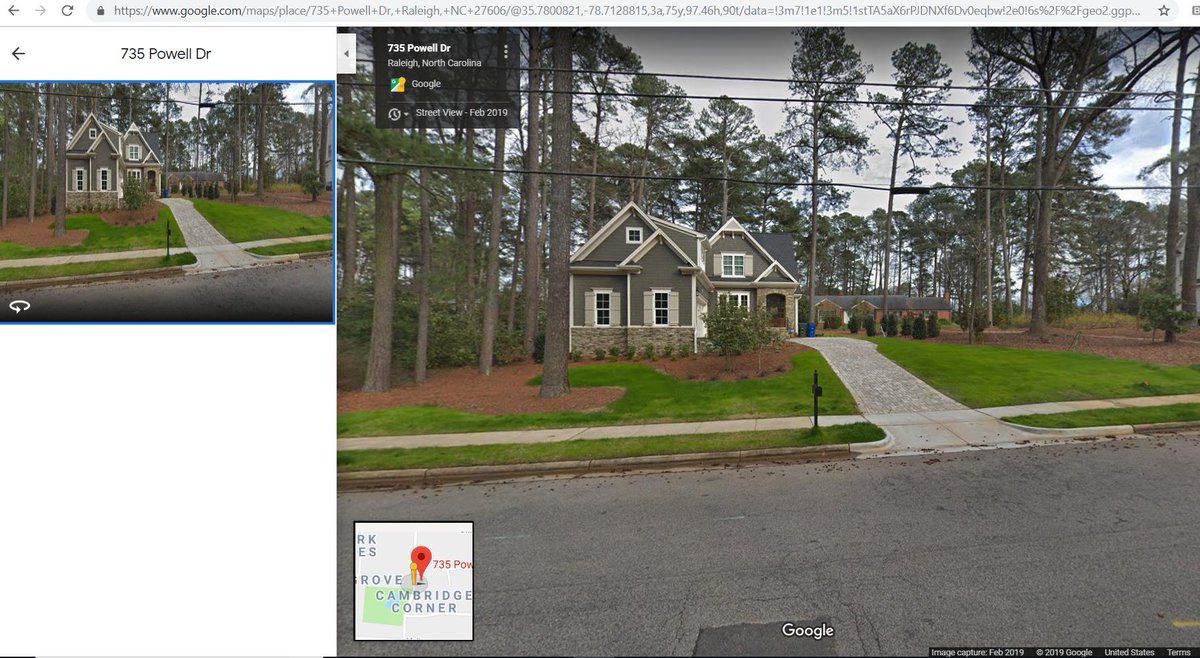
I would need to go look at all of them in google maps to see if they are net new housing, but this gives you the idea for a better method than looking in zillow to get the official number of houses built in 2018 for an area. I think that is it for methodology. Thoughts advice?

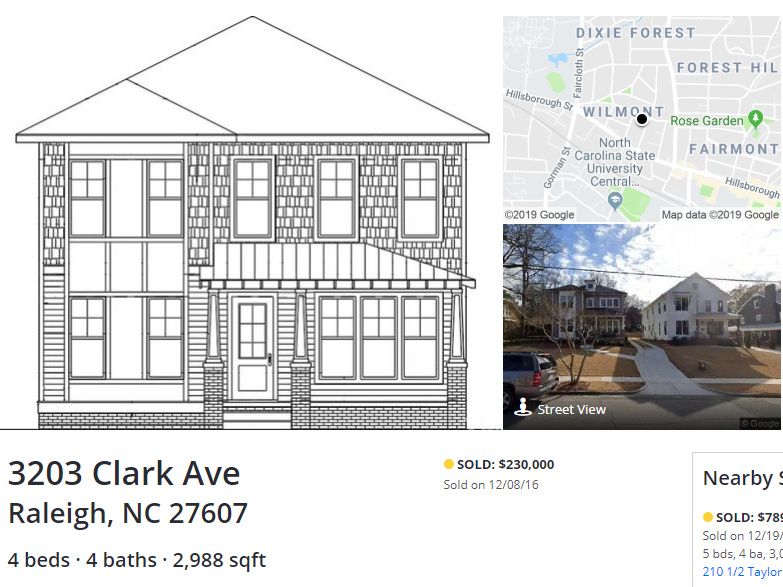
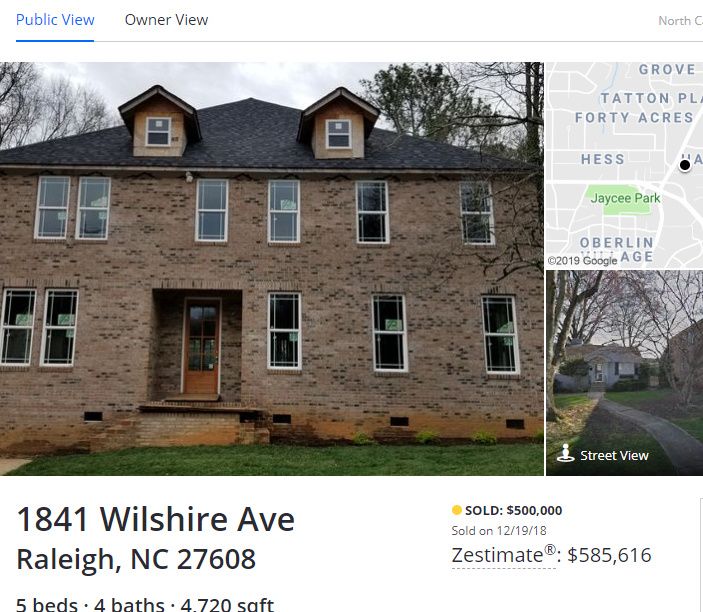
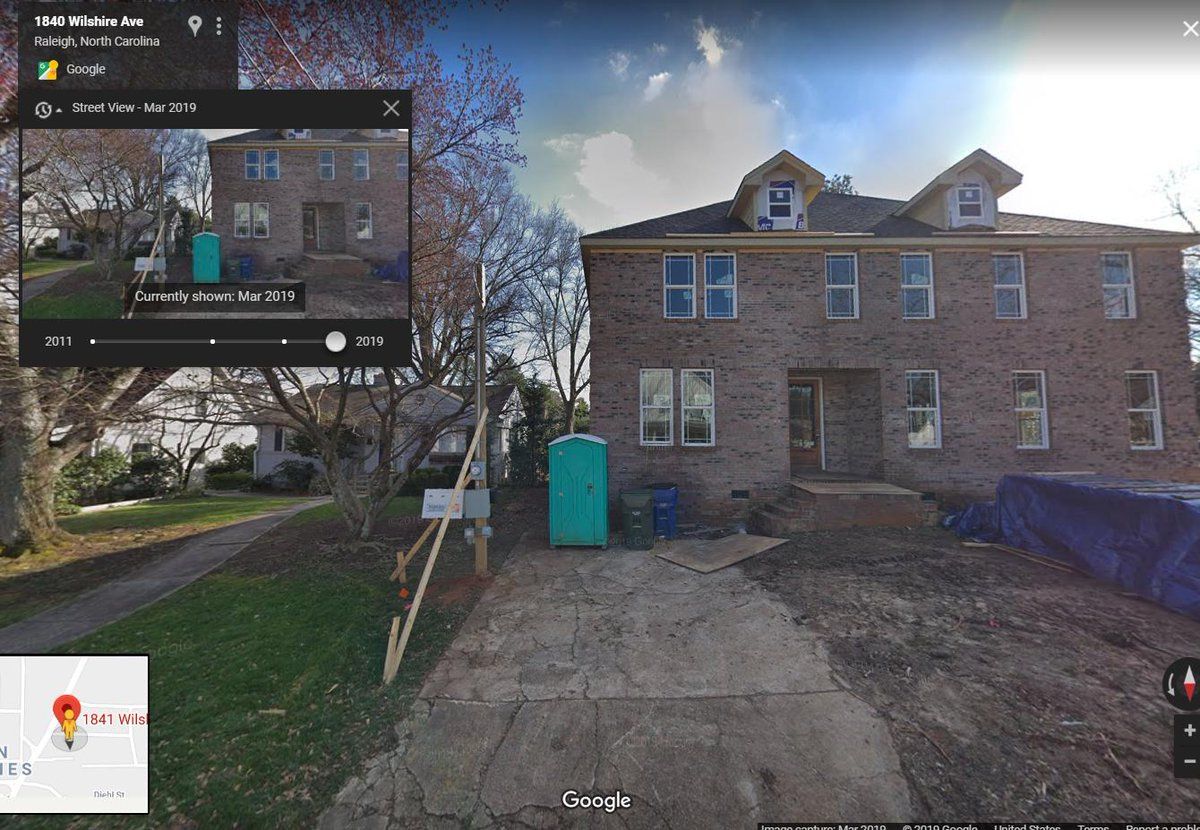
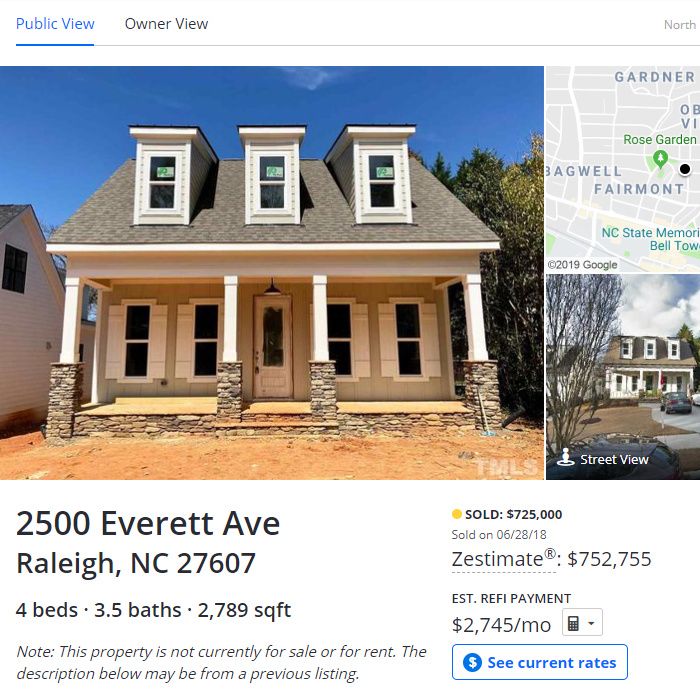
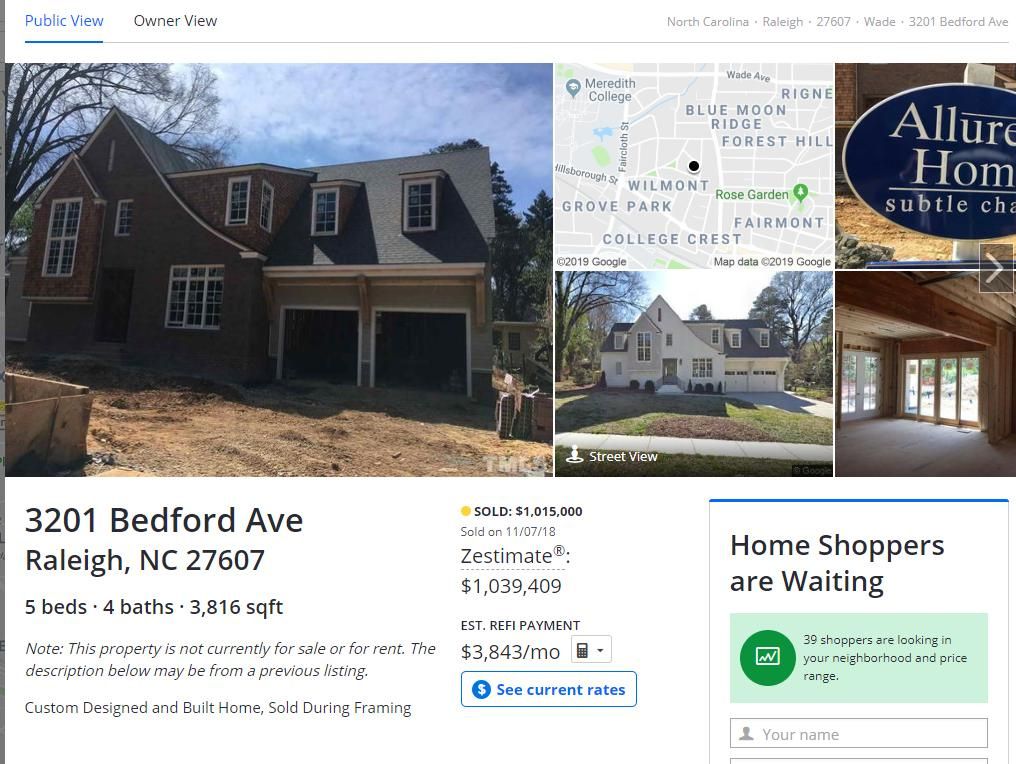
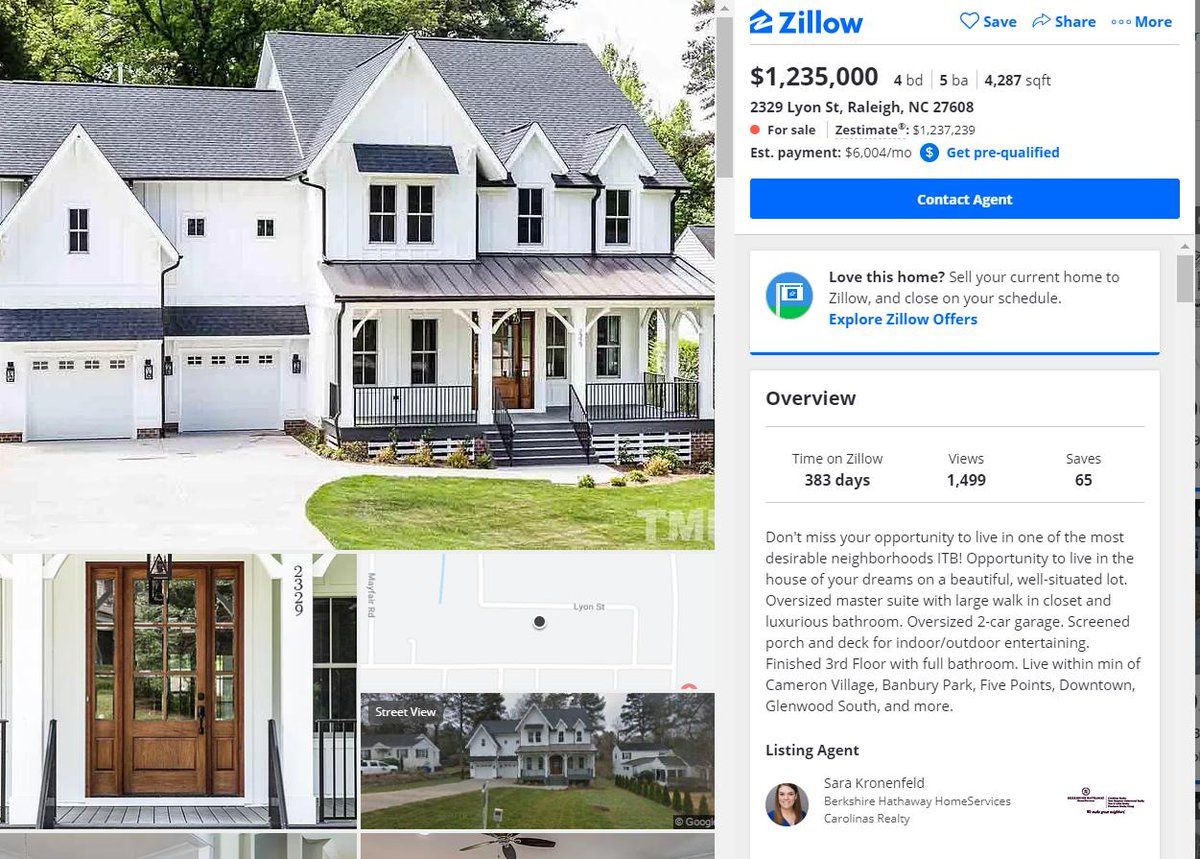
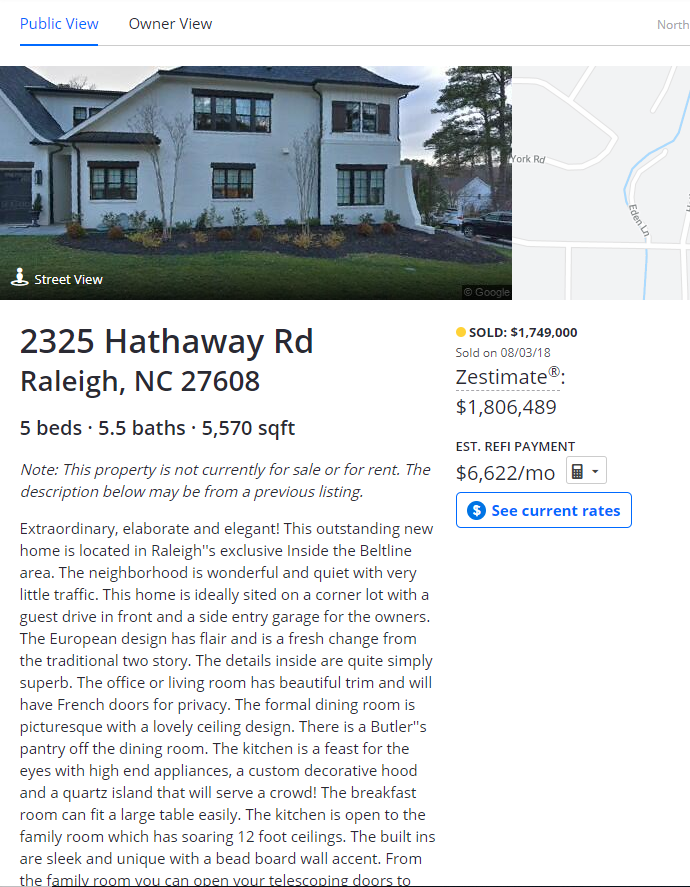
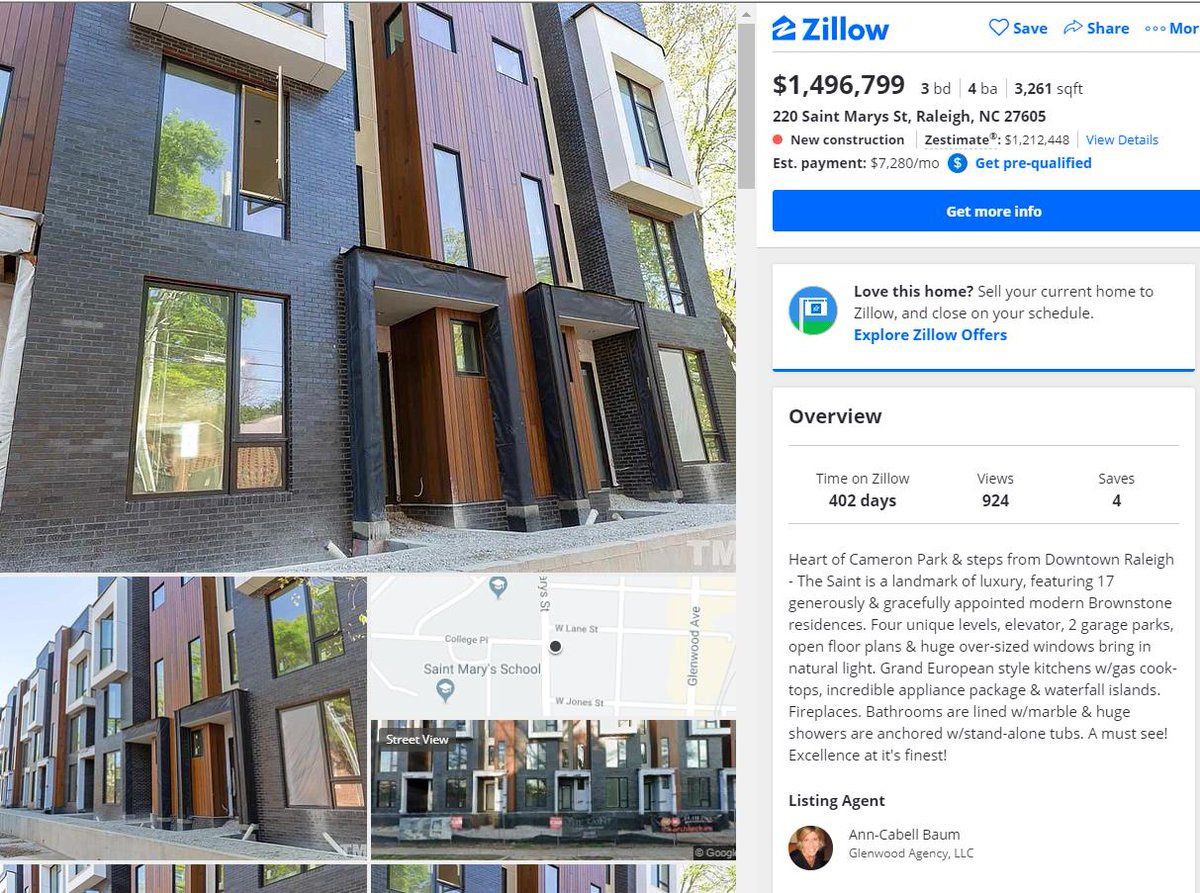
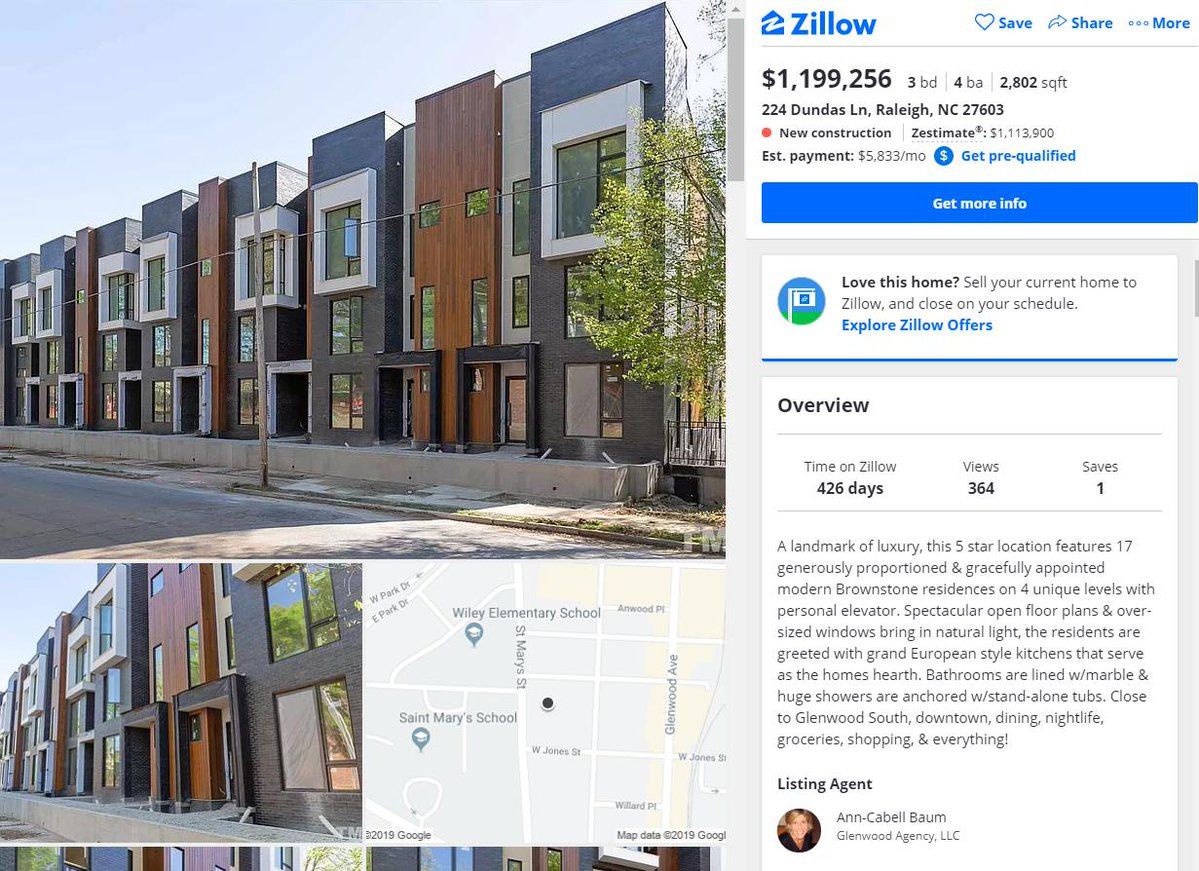
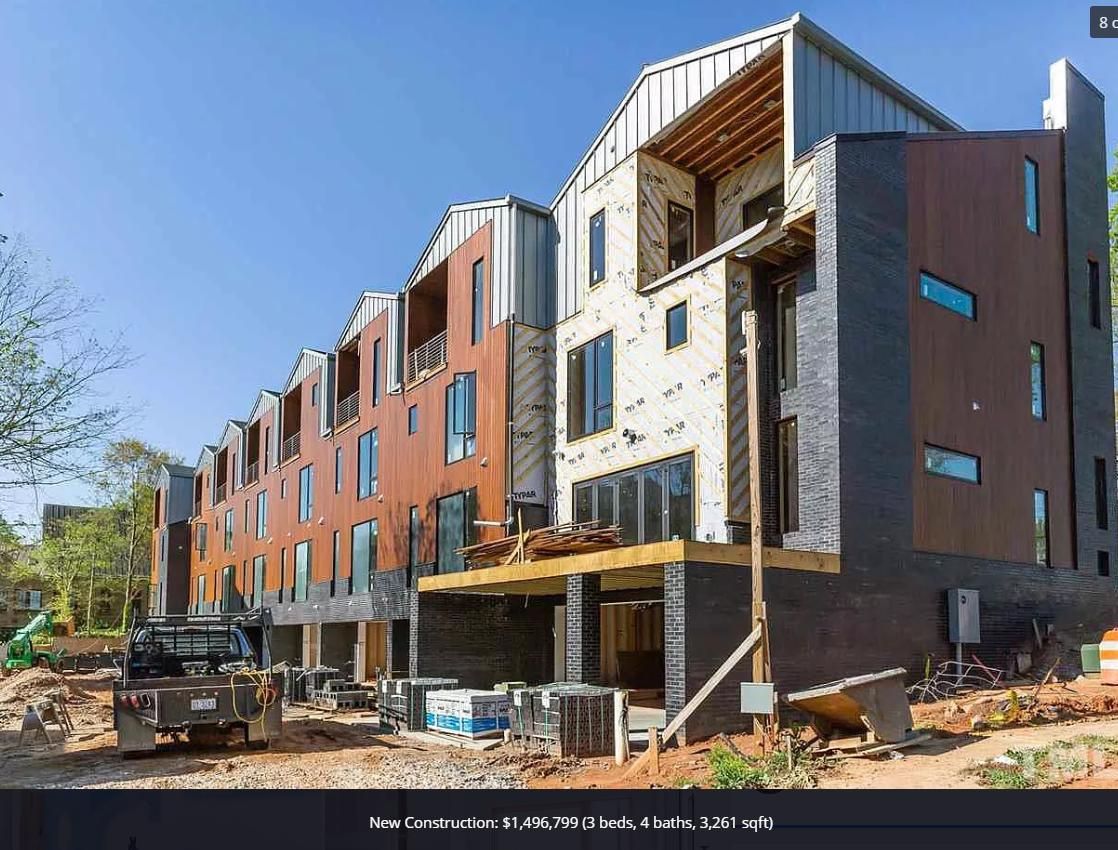
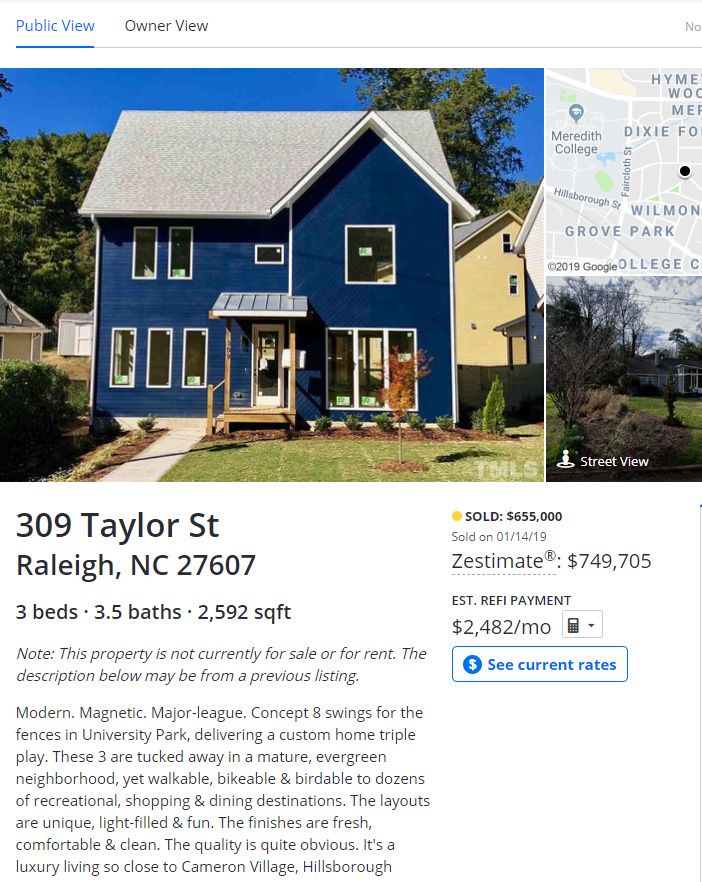
 Not reasonable, just compared to the other homes.
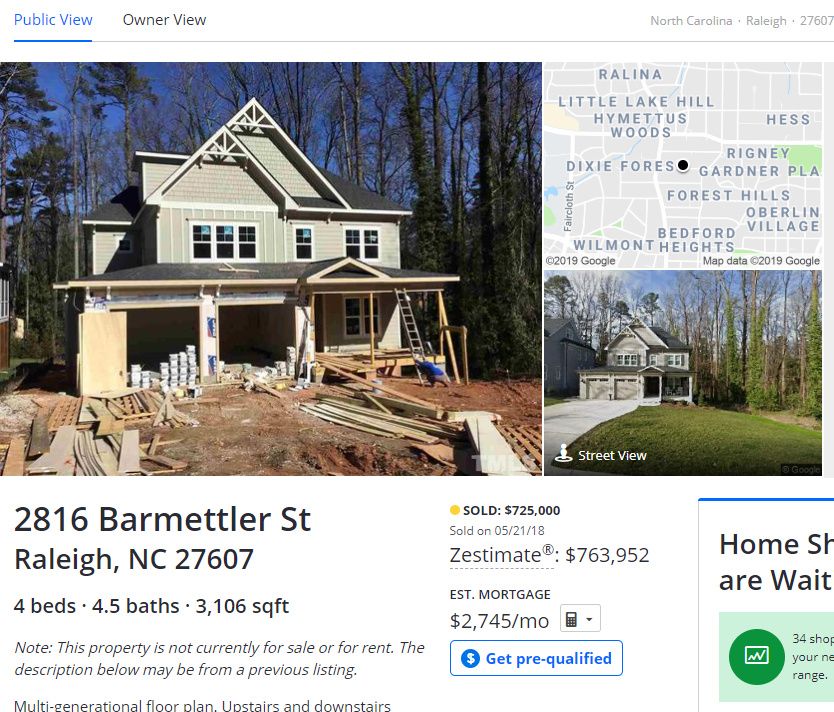

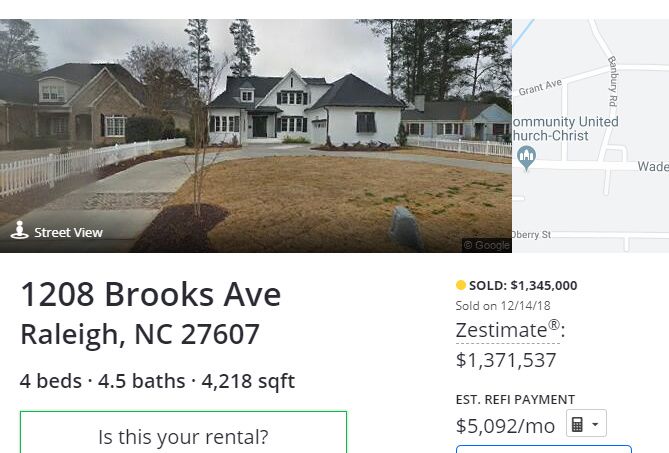
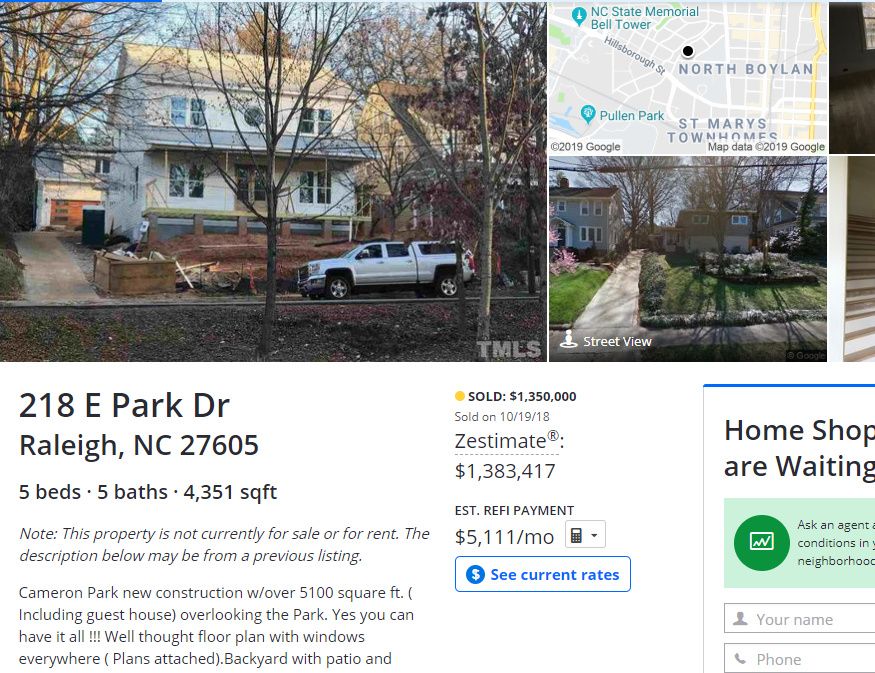
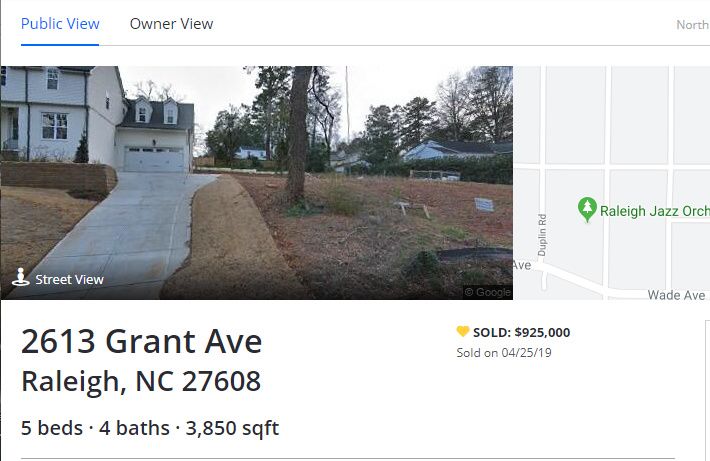
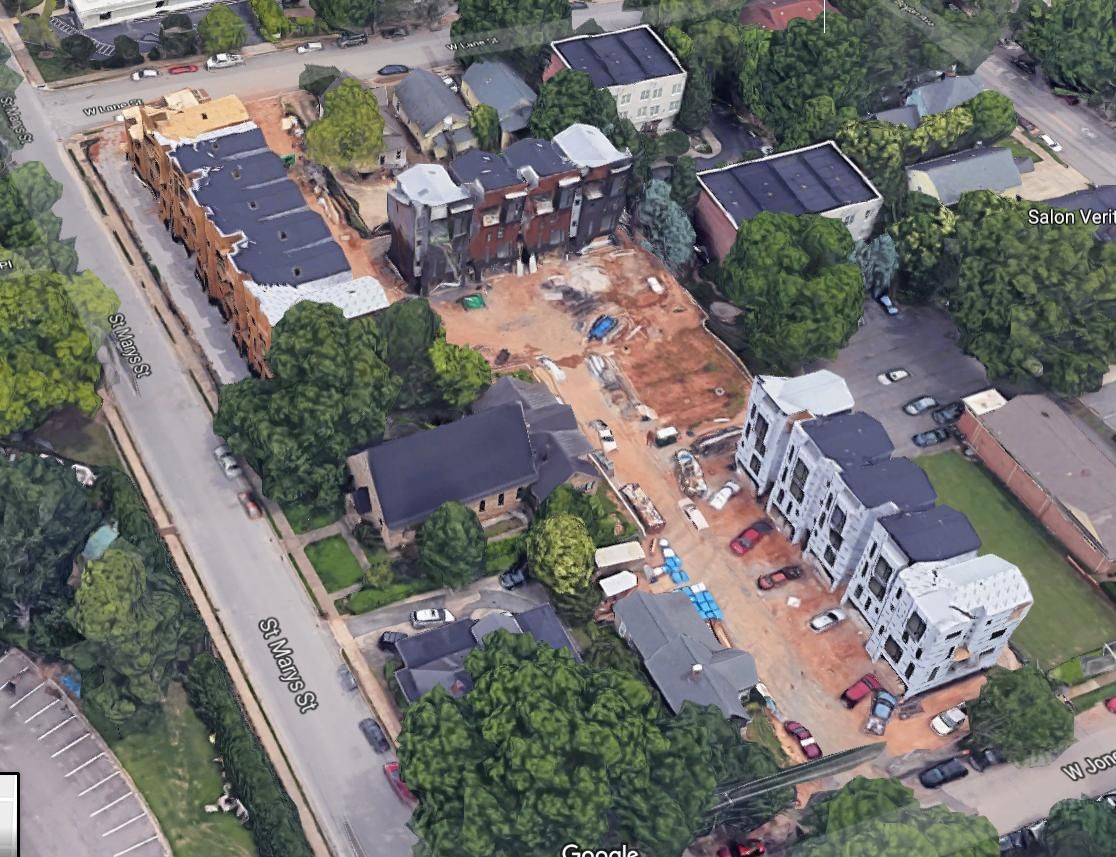
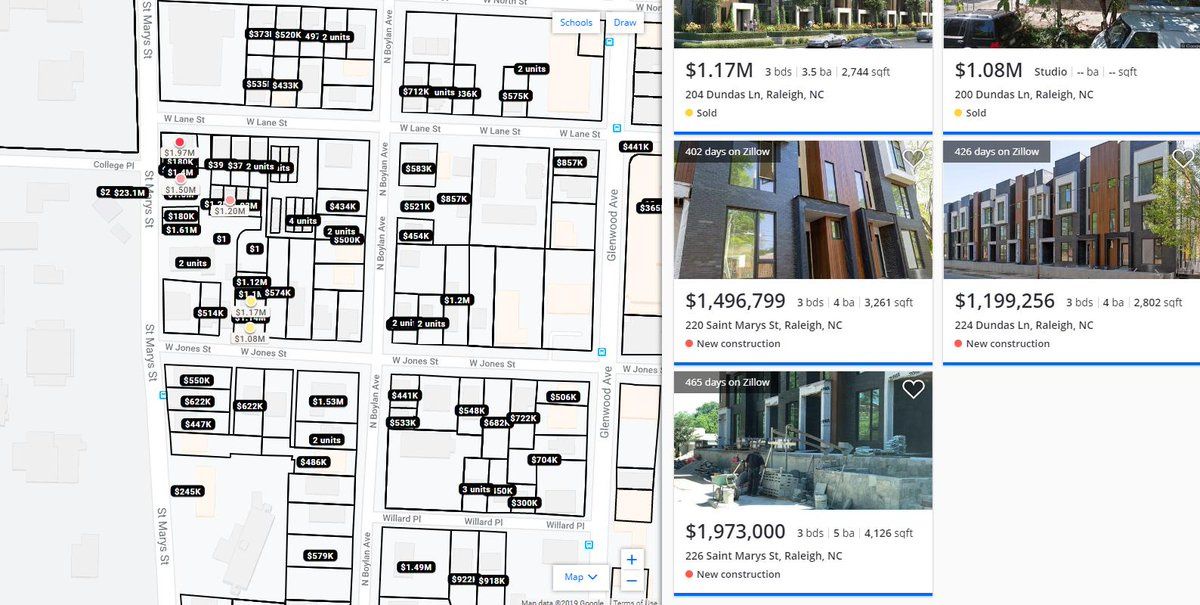


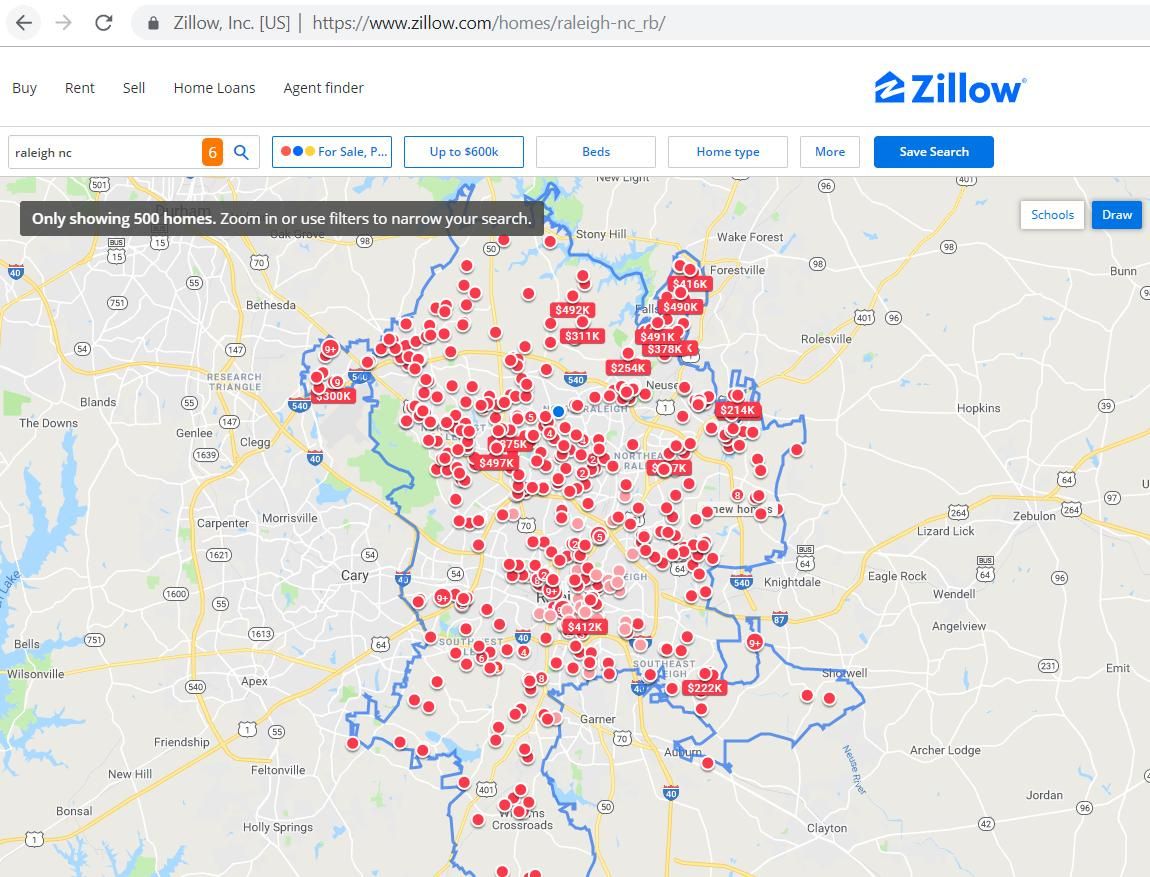
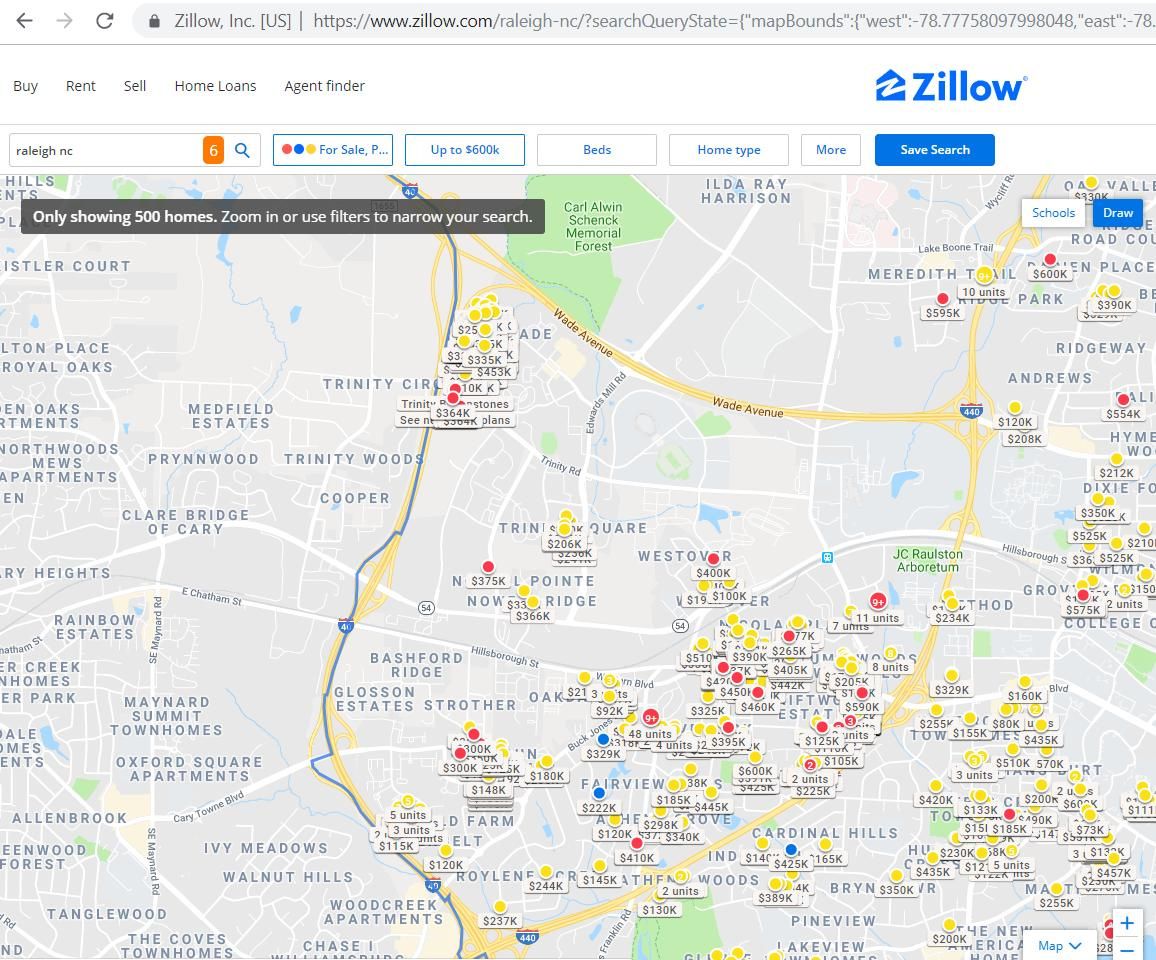
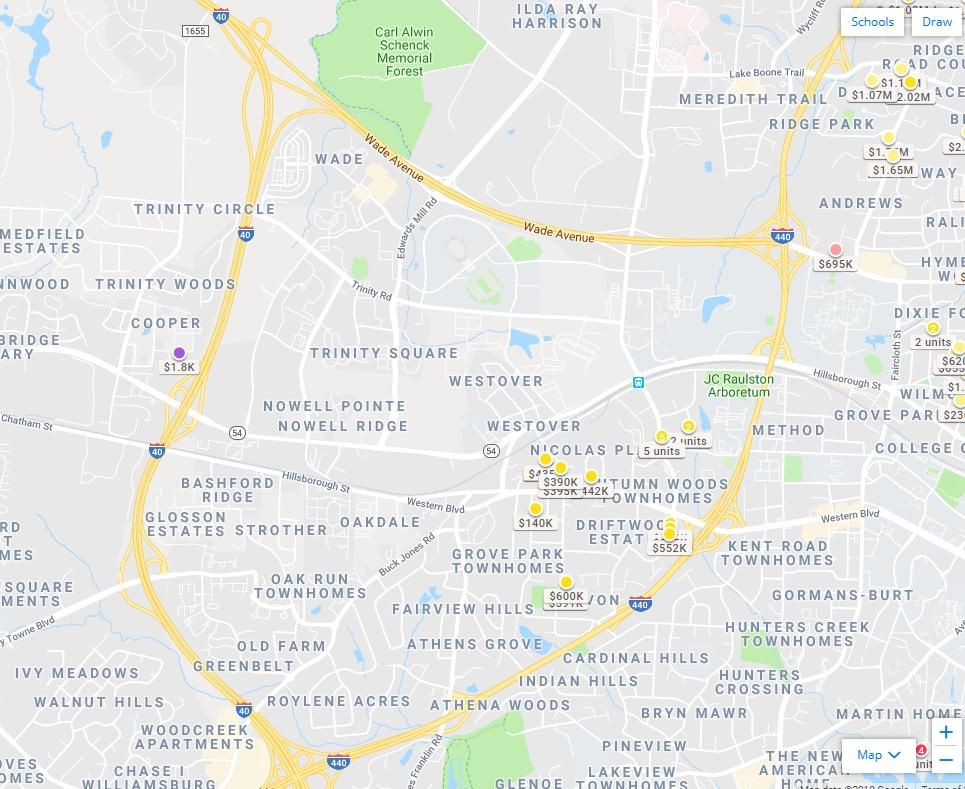
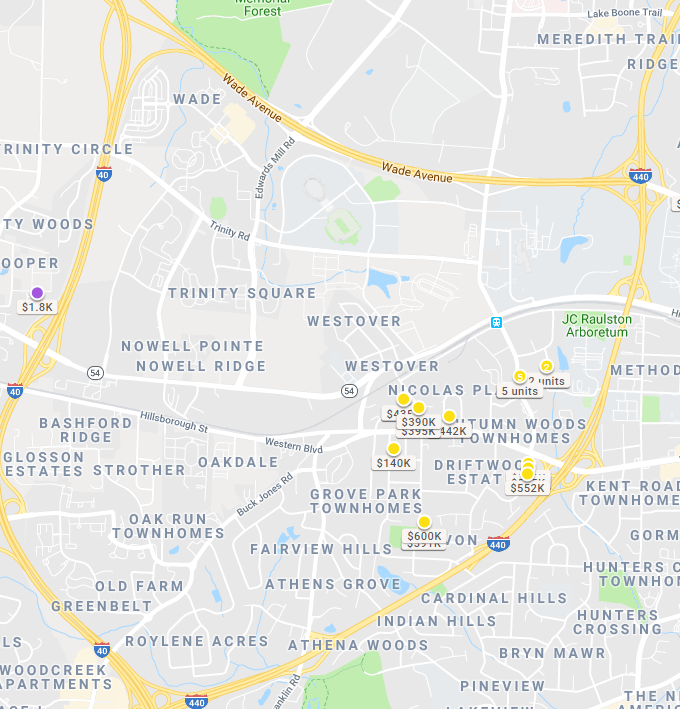
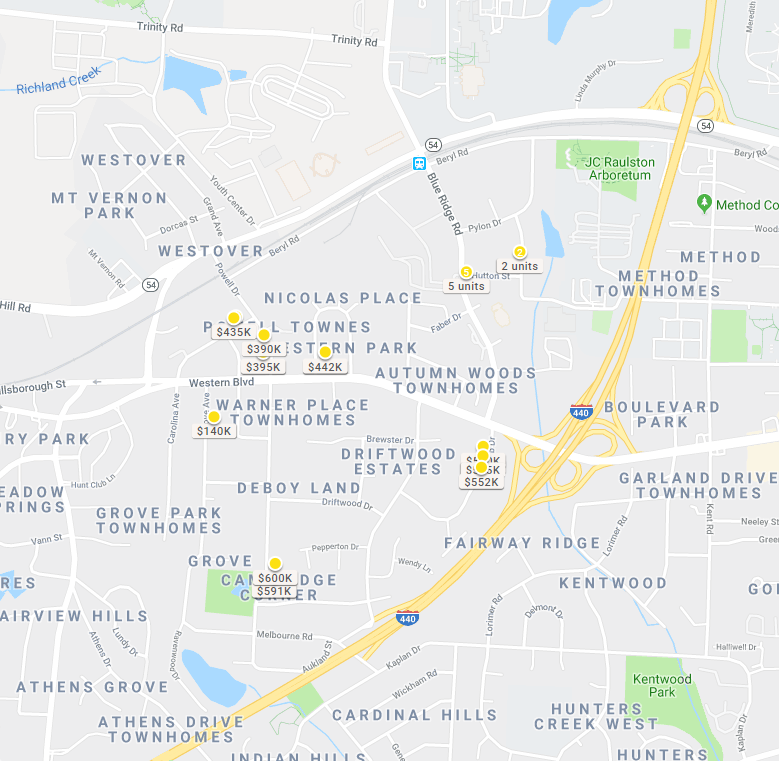


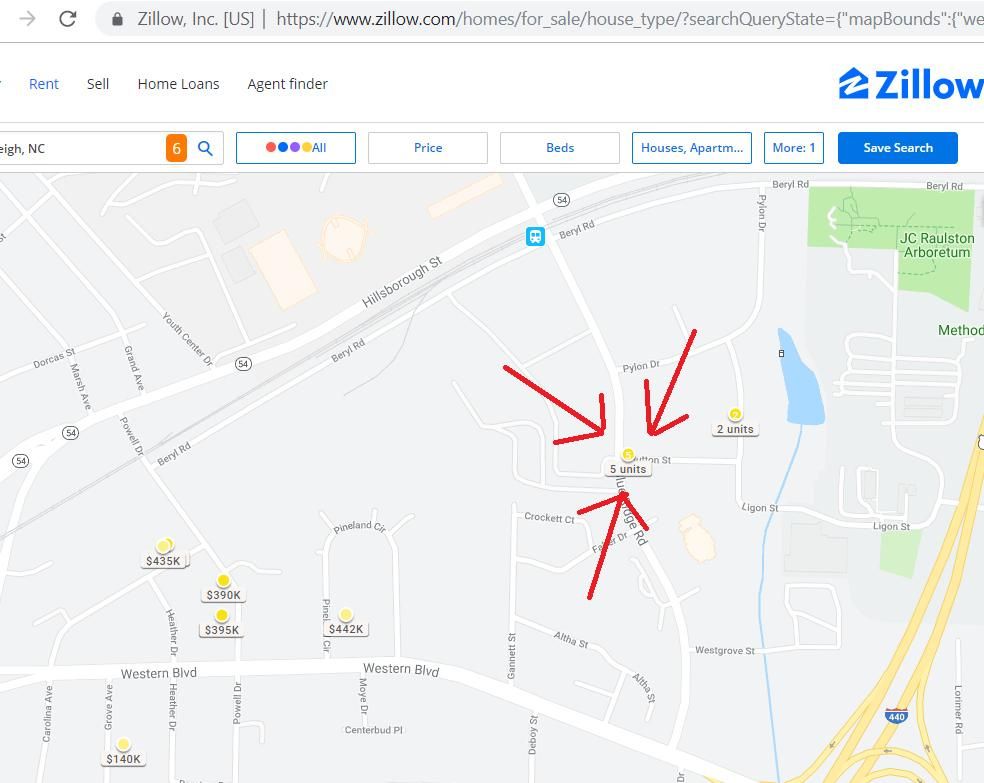
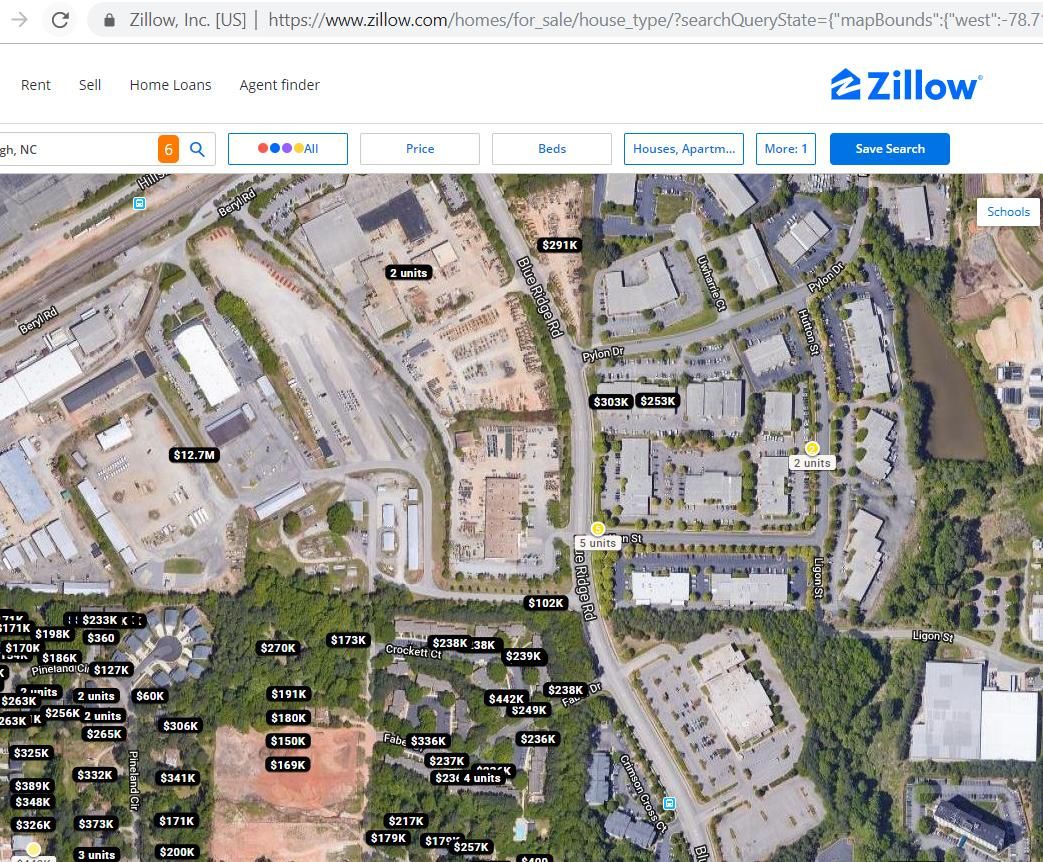
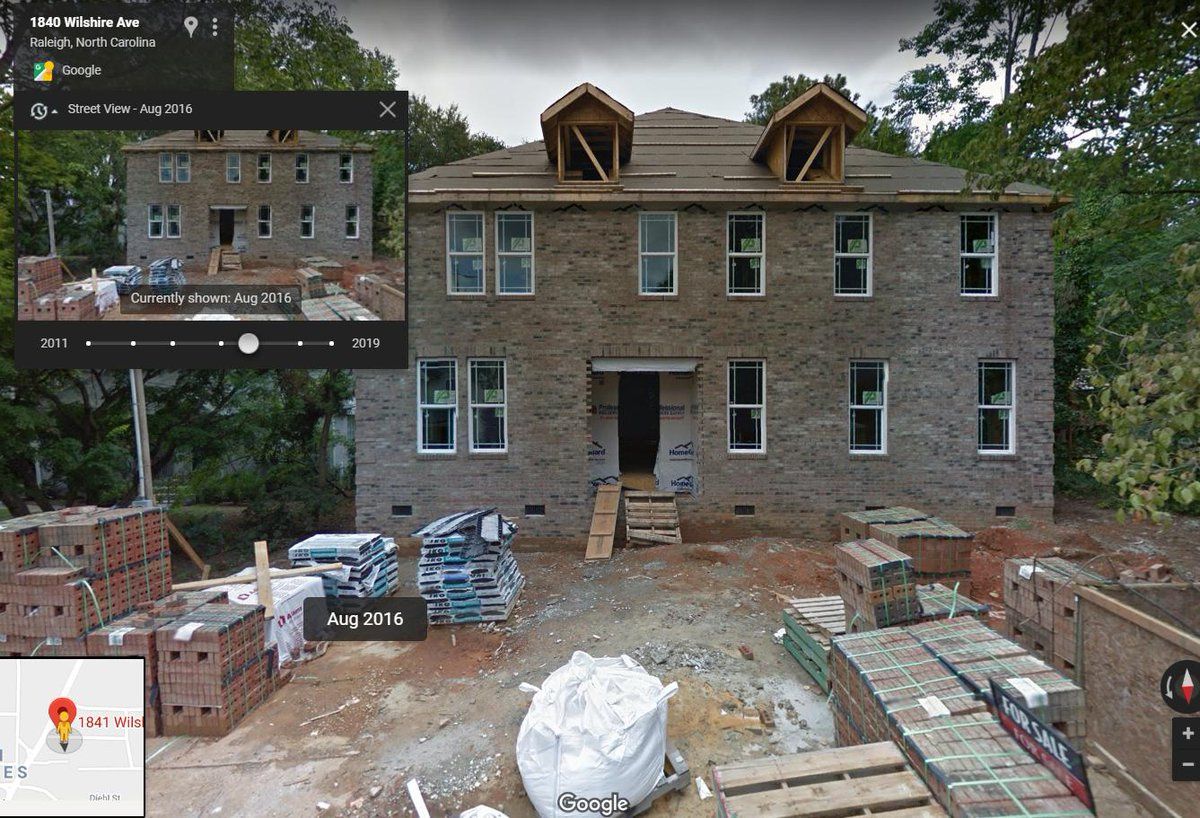
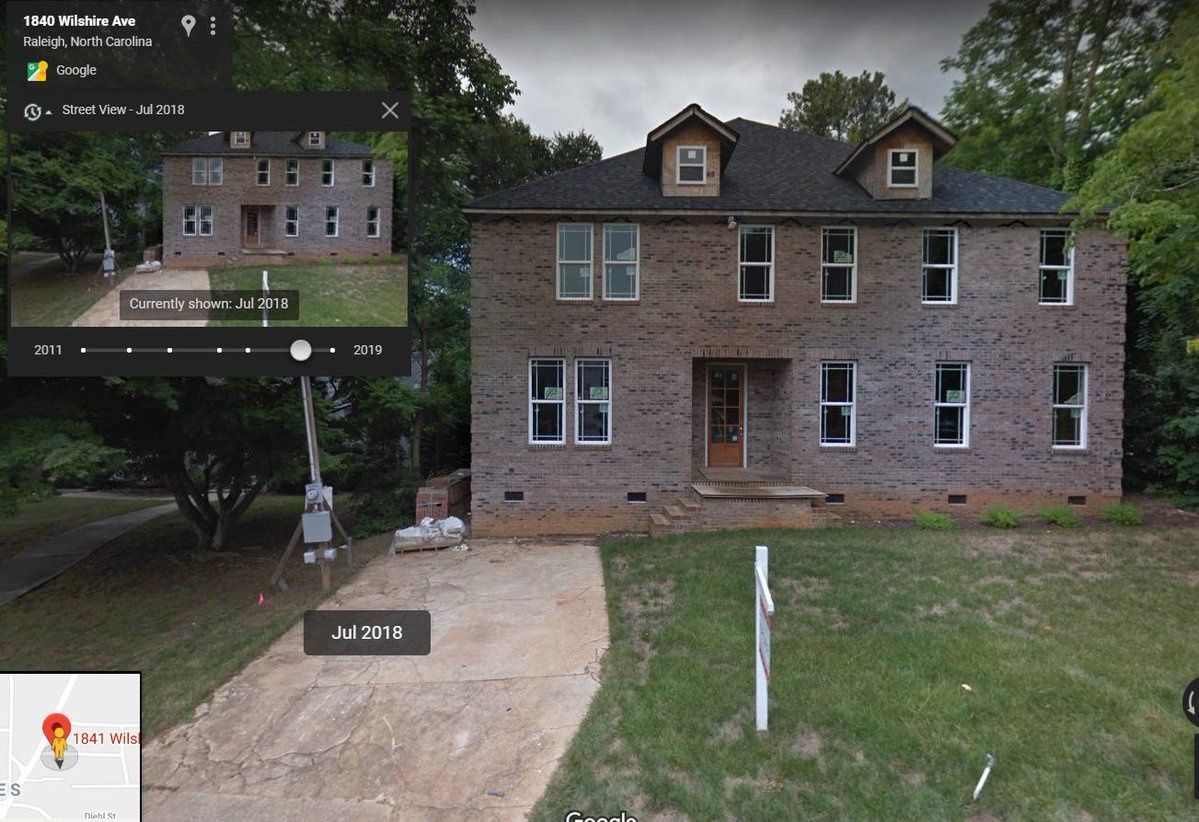
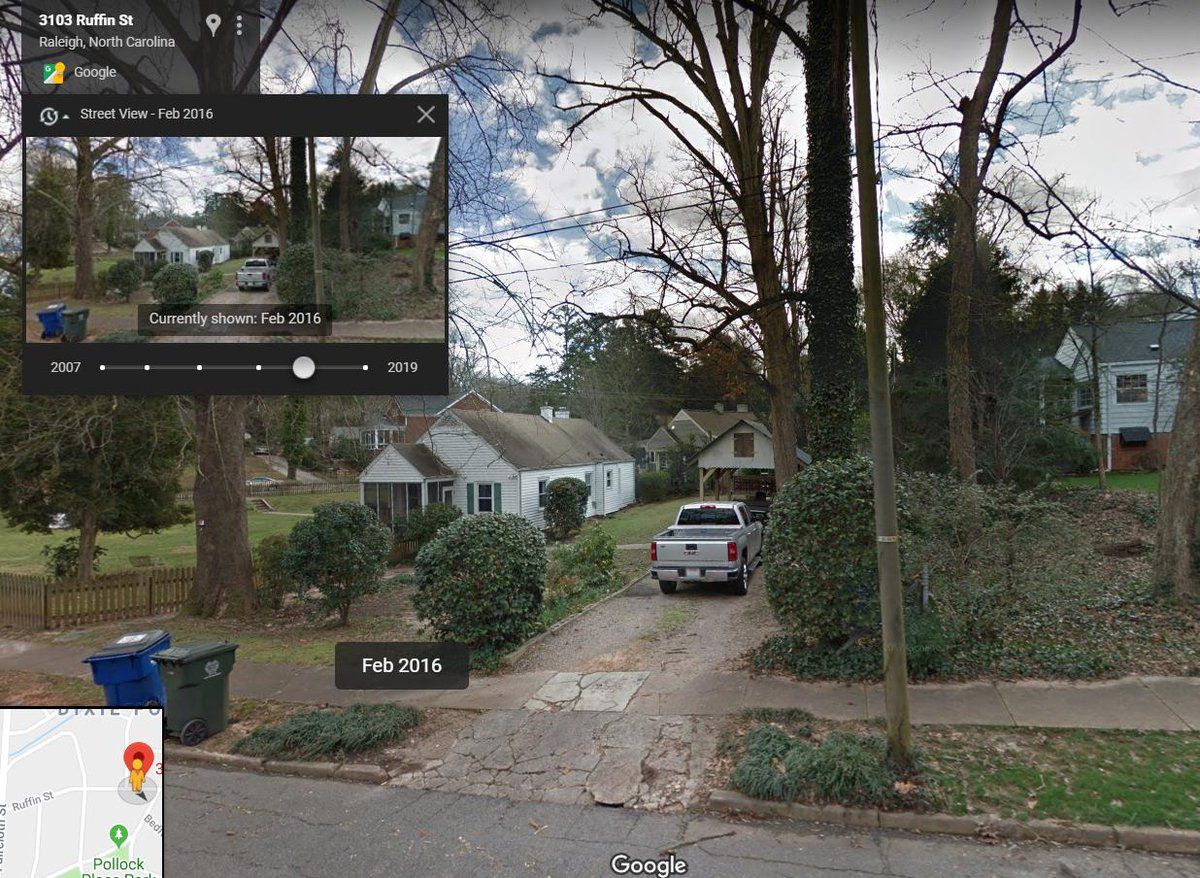
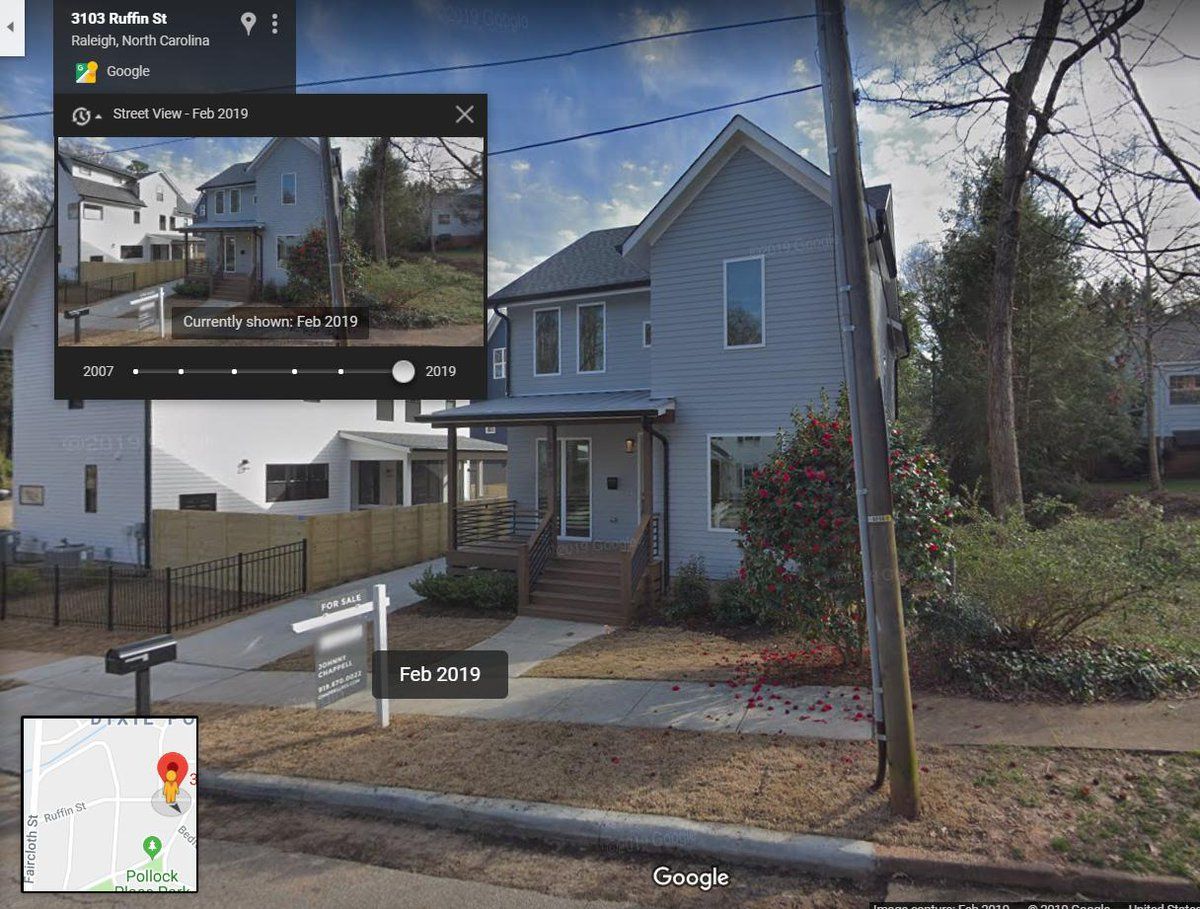
 . There was also some really weird data in zillow. Like these 5 homes. Zoom in & get a birdseye view which makes me thing these SFHs are not there.